This was updated on 7 September 2016 and is provided here for reference purposes:
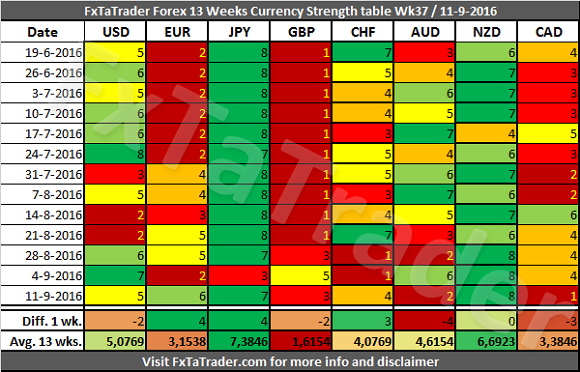
Strong:Â USD, JPY, NZD. The preferred range is from 6 to 8.
Average:Â CHF, AUD, CAD. The preferred range is from 3 to 5.
Weak: EUR, GBP. The preferred range is from 1 to 2.
______________________________________
13 Weeks Currency Score Strength
The 13 Weeks Currency Strength and the 13 Weeks Average are provided here below. This data and the “3 months currency classification” are considered for deciding on the preferred range. Because it is not ideal nor desired to change the range for a currency every single week, we perform several checks to avoid this.
- First of all the strength over a period of 13 weeks. See each row for more information.
- Then the 13 weeks average, see the last row called “Avg. 13 wks.”
- The number of weeks that a currency is stronger than another currency can also be evaluated.
- The TA Charts for each Time Frame can also be consulted.
- Besides these the “13 weeks Currency Classification” chart of each currency is also consulted and compared.

The Strong Currencies
In the month of August the USD had a weak period but it recovered in the weeks of September. The JPY had a low score of 3 in Week 36 but recovered this last week from it. The NZD had no pullback and is the strongest currency in the last weeks. For now the classification made on August 7 remains valid and the strong currencies are back on track. Below is the Weekly Currency Score Chart for the strong currencies with 6 months data as a reference.

_____________________________________
Currency Score Comparison
“Comparison table” and the “Ranking and Rating list”
The Forex Currency Comparison Table compares each currency with its counterpart based on the Currency Score. For more information about the currency Score of this week you can read the article “Forex Ranking, Rating and Score” which is published every week together with this article.
By using the comparison table directly below you can get a view without the volatility and statistics as opposed to the “Ranking and Rating list”. Only the strength of each currency against the counterparts is analyzed by using the Technical analysis charts of the 4 Time Frames that are also used for the “Ranking and Rating List”.Â
The information from the Comparison Table is the source for calculating the “Ranking and Rating List” where this list uses additionally the volatility and statistics for creating the best and worst performer in the list from number 1 to 28.
