In Respect & Remembrance Of Our Veterans
In 1985, President Ronald Reagan gave what is sometimes referred to as a Veterans Day Prayer speech at Arlington National Cemetery. He spoke a great deal of the sacrifices made by our veterans, including that of their lives. He highlighted what brought them to the point of paying that cost — failed peace:
“They gave up everything for our country, for us. And all we can do is remember.
And the living have a responsibility to remember the conditions that led to the wars in which our heroes died. Perhaps we can start by remembering this: that all of those who died for us and our country were, in one way or another, victims of a peace process that failed; victims of a decision to forget certain things; to forget, for instance, that the surest way to keep a peace going is to stay strong.
Weakness, after all, is a temptation — it tempts the pugnacious to assert themselves — but strength is a declaration that cannot be misunderstood. Strength is a condition that declares actions have consequences. Strength is a prudent warning to the belligerent that aggression need not go unanswered.
Peace fails when we forget what we stand for. It fails when we forget that our Republic is based on firm principles, principles that have real meaning, that with them, we are the last, best hope of man on Earth; without them, we’re little more than the crust of a continent. Peace also fails when we forget to bring to the bargaining table God’s first intellectual gift to man: common sense. Common sense gives us a realistic knowledge of human beings and how they think, how they live in the world, what motivates them. Common sense tells us that man has magic in him, but also clay. Common sense can tell the difference between right and wrong. Common sense forgives error, but it always recognizes it to be error first.
Peace is only maintained and won by those who have clear eyes and brave minds. Peace is imperiled when we forget to try for agreements and settlements and treaties; when we forget to hold out our hands and strive; when we forget that God gave us talents to use in securing the ends He desires. Peace fails when we forget that agreements, once made, cannot be broken without a price.
We’re surrounded today by the dead of our wars. We owe them a debt we can never repay. All we can do is remember them and what they did and why they had to be brave for us. “
Reagan’s successors would be wise to heed his insightful words on what it takes to reach a truly lasting peace.
My family and I thank each of you who served, and for the sacrifices you have made, so that we may live in peace. Thank you.
Review & Update
Let me pick up with where I left off last week:
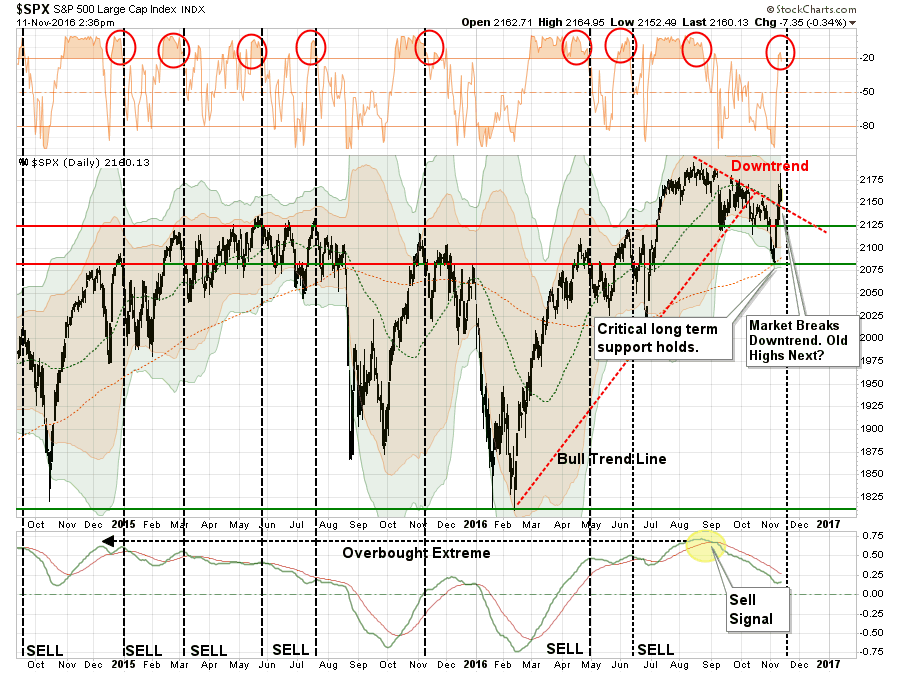
“This past week that support gave way leading to the first 9-day straight decline in the index since 1980.Â
However, as I explained during the “Real Investment Hourâ€Â on Thursday, it is never advisable to “panic sell†when a break of support occurs. This is because that by the time you have an extended period of selling, the markets tend to be oversold enough for a short-term reflexive bounce to rebalance portfolio risk at better levels.Â
The chart below is a daily chart showing the market currently bouncing off support at the 200-dma combined with a 3-standard deviation move from that short-term moving average. This all suggests a reflexive bounce from oversold conditions is extremely likely.â€
Well, following a 700-point plunge during election night on Tuesday, rally we did.

Last week, I detailed the various levels of overhead resistance to any rally that must be defeated to reinstate a more bullish market.
- The downtrend resistance from the previous highs is colliding with the previous support level which now acts as important resistance.
- The 50-dma is also trending downward adding further resistance to price advances in the near-term.Â
- An important “sell signalâ€Â has been registered at fairly high levels and current remains intact.
The post “Trexitâ€Â rally that started on Wednesday took out the first two levels of resistance with some ease. However, the “sell signalâ€Â remains intact with the market now back to extreme oversold levels as shown by the red circles at the top of the chart.
The good news is the market is holding above the downtrend resistance line currently which puts all-time highs as the next logical point of attack if this bull market is to continue.
However, is we step back to a longer-term (weekly) picture we get a little clear picture about the overall directional trend of the market.

I like weekly charts because the “noiseâ€Â of daily volatility in price action is removed. As shown in the chart above, the “sell signalâ€Â remains intact but, as opposed to the daily chart previously, the reflexive move has only taken stocks back to retest the underside of the longer-term bearish “downtrendâ€Â line.
This suggests, the current move may be near its limits and the short-covering frenzy seen on Wednesday and Thursday of this past week is near completion. As I stated last week:
“As shown, the sell signals that are currently being registered in the market have typically suggested further deterioration in the markets to come. This supports the idea that any reflexive bounces, particularly post-election next week, should be used to rebalance portfolio risk accordingly.â€
That advice seems salient once again this week.
4-Standard Deviations Ain’t Sustainable
Standard deviation is a statistical term that measures the amount of variability or dispersion around an average. Standard deviation is also a measure of volatility. Generally speaking, dispersion is the difference between the actual value and the average value. The larger this dispersion or variability is, the higher the standard deviation. The smaller this dispersion or variability is, the lower the standard deviation. Chartists can use the standard deviation to measure expected risk and determine the significance of certain price movements.
This assumes, of course, that price changes are normally distributed with a classic bell curve. Even though price changes for securities are not always normally distributed, chartists can still use normal distribution guidelines to gauge the significance of a price movement. In a normal distribution, 68% of the observations fall within one standard deviation. 95% of the observations fall within two standard deviations. 99.7% of the observations fall within three standard deviations. Using these guidelines, traders can estimate the significance of a price movement. A move greater than one standard deviation would show above average strength or weakness, depending on the direction of the move.

Furthermore, since prices can only move, or deviate, within a limited range from their moving average, this analysis can help determine the extent to which a move is completed.
The move following the election took the Dow Jones Industrial Average to 4-standard deviations of its moving average. A feat that has only been rarely witnessed previously and has been coincident with short to intermediate-term corrections or worse.
