USD/CAD reversed directions and posted modest losses last week. The pair closed at 1.3471. This week’s highlights are the retail sales reports. Here is an outlook on the major market-movers and an updated technical analysis for USD/CAD.
US inflation numbers were mixed, while unemployment claims dropped to a 43-year low. In Canada, Manufacturing Sales beat the estimate, while CPI readings were within expectations.
Updates:
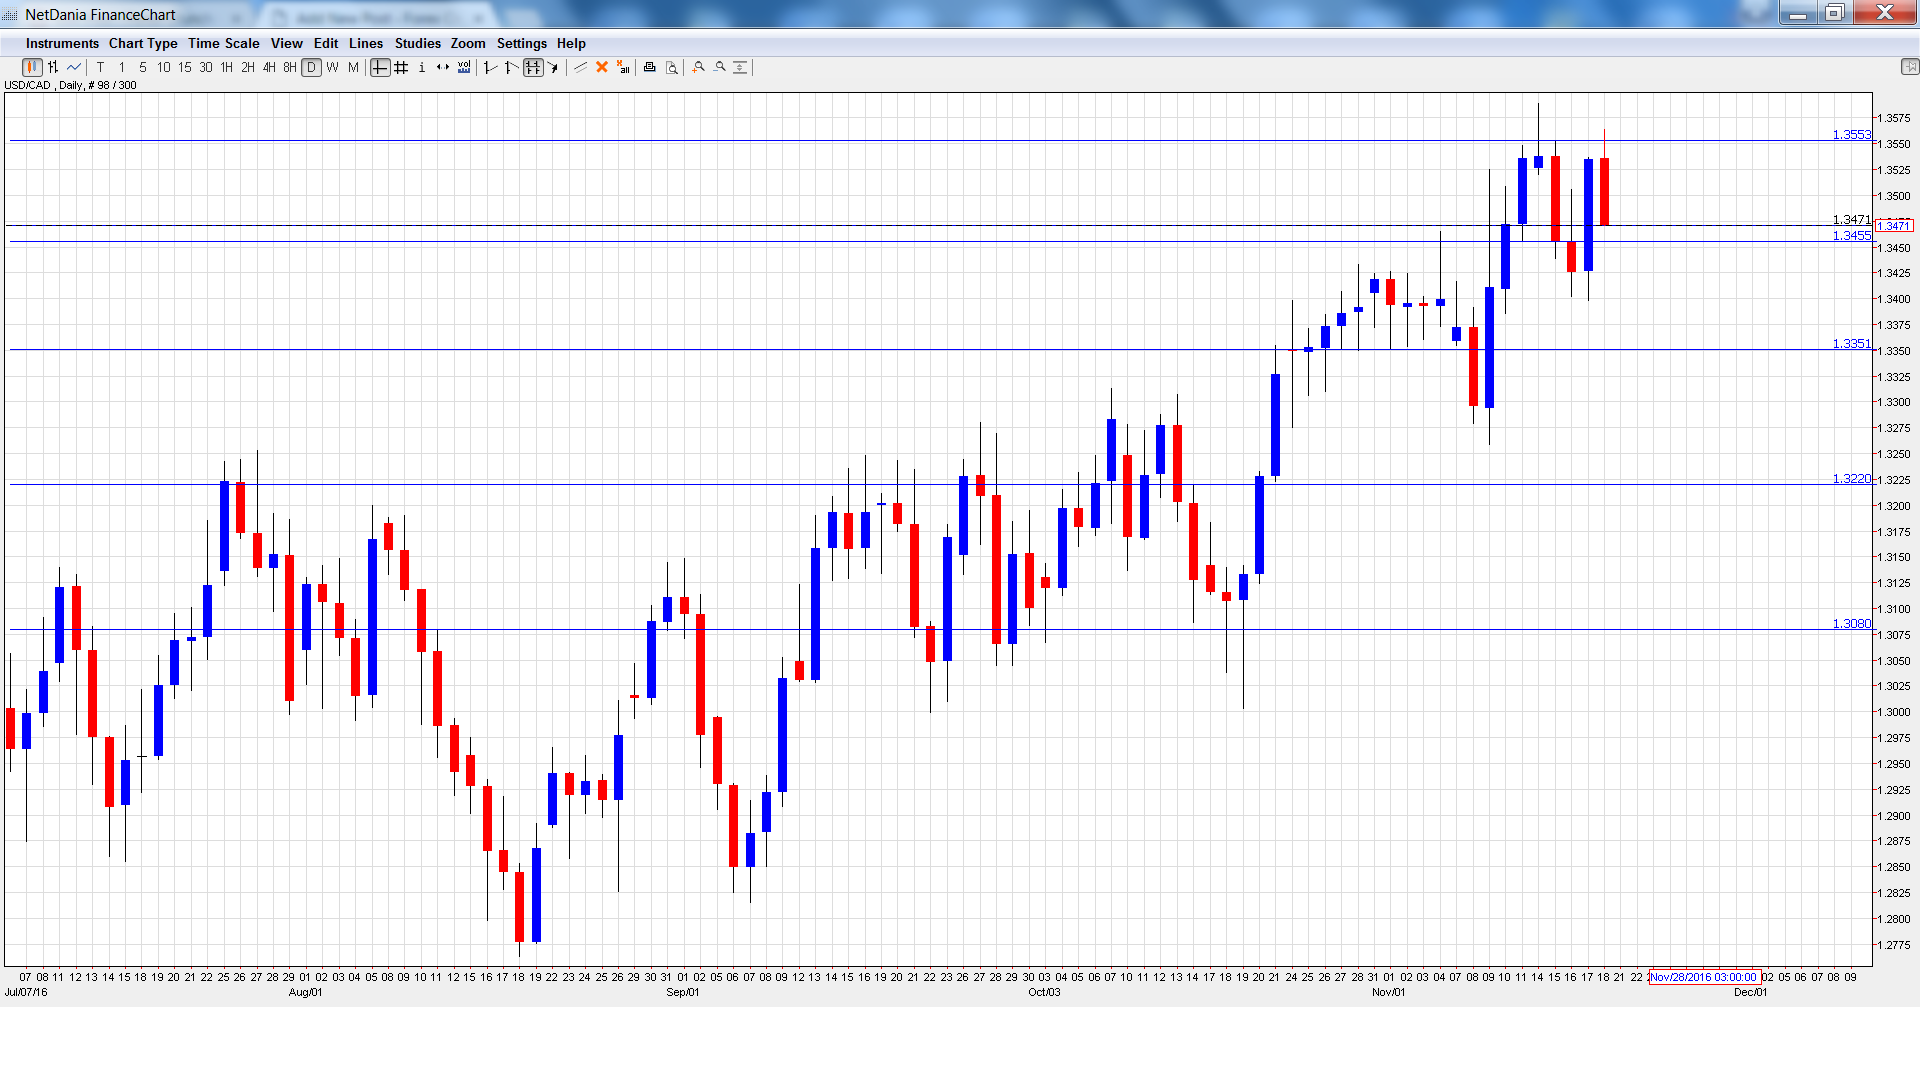
USD/CAD daily graph with support and resistance lines on it. Click to enlarge:

- Wholesale Sales:Â Monday, 13:30. The indicator jumped 0.8% in August, crushing the forecast of 0.2%. The estimate for the September report stands at 0.3%.
- Core Retail Sales: Tuesday, 13:30. This is the key event of the week. The indicator has failed to post a gain since June. However, the indicator is expected to rebound in September, with a forecast of 0.6%
- Retail Sales: Tuesday, 13:30. Retail Sales has posted three straight readings of -0.1%, all of which missed expectations. The markets are expecting a strong turnaround in September, with an estimate of 0.7%.
- Corporate Profits: Thursday, 13:30. Continuing declines in this indicator point to trouble in the business sector. In September, the indicator posted a decline of 3.4%.
USD/CAD opened the week at 1.3526 and touched a high of 1.3589, testing support at 1.3551 (discussed last week). USD/CAD then reversed directions and dropped to a low of 1.3398. The pair closed the week at 1.3471.
Live chart of USD/CAD:
Technical lines, from top to bottom
We start with resistance at 1.3911.
1.3813 was a cushion in January and February.
1.3672 is next.
1.3551 was tested early in the week as the pair moved higher before retreating.
1.3457 is a weak support level. This line was a cap in September 2015.
1.3351Â is next.
1.3219 was a cap in April.
1.3081 is the final support line for now.
I remain bullish on USD/CAD
