For the last two weeks, since the US elections, we’ve been discussing the possibility of strong inflection points building out on many different areas of the markets. These are areas where the markets can turn on a dime leaving those folks looking one way while the markets go the opposite way. Important inflection points are more of a price thing than a time thing. An inflection point can last days or weeks before they finally resolve themselves.
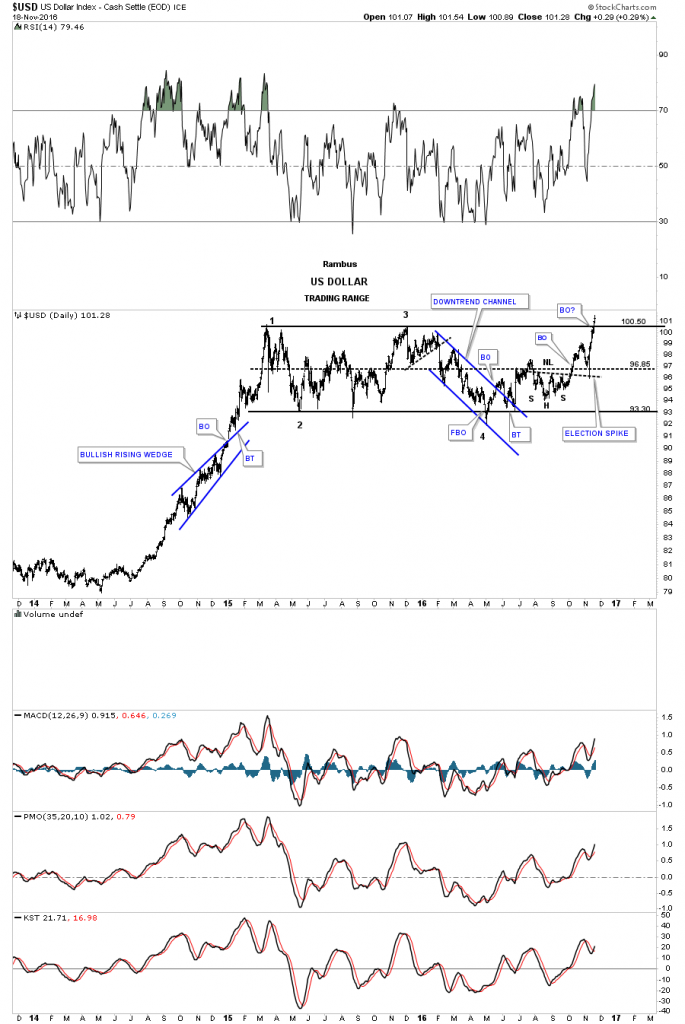
Lets start by looking at the US dollar, as it plays such a key role in so many markets. Below is a three year daily chart which shows its major impulse leg up out of the mid 2014 low, and topped out in the spring of 2015. For just under two years the US dollar has been chopping out a sideways trading range, rectangle consolidation pattern, and closed above the top rail this week. The breakout is not actually confirmed yet as the price action would have to close above the 103 area and then a backtest to the top rail around 100 would have to hold. For the time being, we have to give the benefit of a doubt, to the US dollar bulls until proven otherwise.
There is one thing I would like you to show you before we move on and that is the backtest to the neckline, which occurred during the US elections. That sharp reversal off the neckline needs to be respected, as that spike shows up in other areas of the markets.

I’m going to skip over the longer term charts for the $USD, as we have been following them pretty closely. There are two other proxy’s for the $USD I would like to show you which may be giving us some confirmation the breakout may be the real thing. Below is a weekly chart for the UUP, which shows its sideways trading range as a bull flag. Note the big breakout gap that occurred last week on heavy volume. A backtest to the top rail would come in around the 25.75 area, which should be expected but not required.
![]()
This next chart for the UUP is a longer term weekly look, which puts the bull flag in perspective. Again, if the UUP is truly breaking out in its next impulse leg up then we should see the backtest hold support at the top rail at 25.75. We have a very clean line in the sand, above the top rail is bullish and below is bearish.

The USDU is another index I like to track for the US dollar. The USDU has a more equal weighting than the $USD. This proxy for the USD actually broke out of a six point diamond consolidation pattern about eight weeks ago. Note how the 30 week ema has done a good job of showing us where support and resistance comes into play. To really confirm the next impulse leg up is truly underway, we’ll need to see the price action takeout the old high at reversal point #3. As the charts above show, this is the strongest the US dollar has been since the beginning of the last impulse leg up in the summer of 2014.
![]()
Keeping these US dollar charts in the back of your mind I would like to show you what I think may be happening in the precious metals complex. First, I’m fully aware that the PM complex and the US dollar can rise in tandem for short periods of time, but in a general sense they pretty much move opposite to each other. As I have stated many times in the past, “the only rule in the markets is, there are no rules.†This is an important concept to understand. It means there are no guarantees of what may have worked previously will work again.
