USD/JPY
4 hour

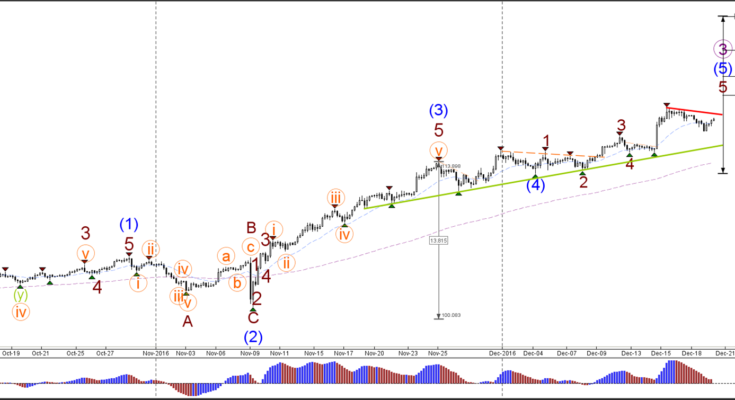
The USD/JPY has built a bearish retracement within the uptrend. A break above the resistance level (red) could see price continue towards the Fibonacci targets.
1 hour

The USD/JPY completed a shallow wave 4 pullback (orange) at the 50% Fibonacci retracement level of wave 4 (orange). A break above the resistance trend line (red) could see price continue towards the Fibonacci targets.
EUR/USD
4 hour

The EUR/USD bullish retracement indeed turned at the broken support (dotted green) and broke below support (dotted blue). A wave 3 (brown) seems likely if price is able to break below the new bottom (green) and the 100% Fibonacci level of wave 3 vs 1.
1 hour

The EUR/USD bearish breakout below support (green) could see price continue with the downtrend.
GBP/USD
4 hour

The GBP/USD downtrend is testing the support level at the 161.8% Fibonacci area. A bearish break below support (blue line) could see price extend its fall towards the Fibonacci targets.
1 hour

The GBP/USD indeed completed a wave 4 (orange) correction at the 38.2% Fibonacci retracement level. The trend line (red) and broken support (dotted greens) should act as a resistance zone. A break below support (blue) could see price extend its fall towards the Fibonacci targets.

