(T2108 measures the percentage of stocks trading above their respective 40-day moving averages [DMAs]. It helps to identify extremes in market sentiment that are likely to reverse. To learn more about it, see my T2108 Resource Page. You can follow real-time T2108 commentary on twitter using the #T2108 hashtag. T2108-related trades and other trades are occasionally posted on twitter using the #120trade hashtag. T2107 measures the percentage of stocks trading above their respective 200DMAs)
T2108 Status: 64.5%
T2107 Status: 63.5%
VIX Status: 13.5
General (Short-term) Trading Call: cautiously bearish
Active T2108 periods: Day #217 over 20%, Day #37 over 30%, Day #36 over 40%, Day #34 over 50%, Day #28 over 60% (overperiod), Day #3 under 70% (underperiod)
Commentary
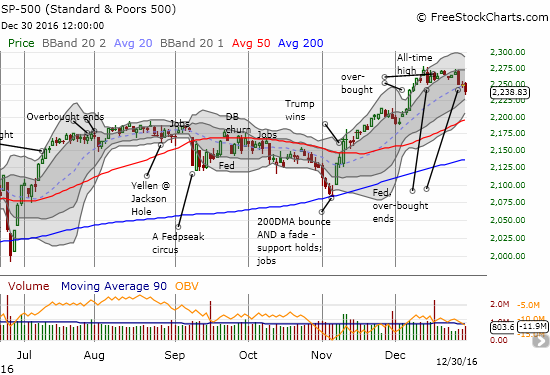
The S&P 500 (SPY) ended 2016 by following through on the bearish trading signals I identified in the last T2108 Update. Friday’s 0.5% loss came on slightly higher volume and on an additional push higher in the volatility index, the VIX. T2108, the percentage of stocks trading above their respective 50-day moving averages (DMAs) dropped to 64.5%.

The S&P 500 ended the year with a whimper as the Santa Claus rally delivered a rare (albeit minor) loss.

The volatility index, the VIX, pushed higher for the fifth straight day.
The Nasdaq (QQQ) delivered an even more convincing loss on the day. The tech-laden index’s 0.9% drop confirmed the end of the previous (short) consolidation period.

The Nasdaq broke its primary uptrend at its 20DMA. A test of 50DMA support is now in play.
Note that both major indices broke through primary uptrends represented by their respective 20DMAs.
Interestingly, several other important signals held their ground right at the edge of additional bearish confirmations.
The iShares Russell 2000 (IWM) topped out three weeks ago, but it is still barely clinging to the bottom of its consolidation range. The Financial Select Sector SPDR ETF (XLF) managed to stay flat a day after finishing a reversal of its last breakout. The previous day, XLF also traded below its primary trend at the 20DMA for the first time since November 4th. The Australian dollar (FXA) versus the Japanese yen (FXY) marked a sixth day in a consolidation pattern that abruptly ended a sharp slide from the most recent high. AUD/JPY’s 50DMA is rushing upward to attempt a delivery of support.
