
The financial markets have seen the future and they like what they see. Starting with the day after the presidential election, the over-riding theme is that investors believe there will be a true recovery featuring strong growth, accelerating inflation and improved corporate profitability. The equity markets are leading the way to higher valuations; the credit markets are taking on more risk; and the commodity markets are enjoying a rally almost across the board.
Pricing to Perfection
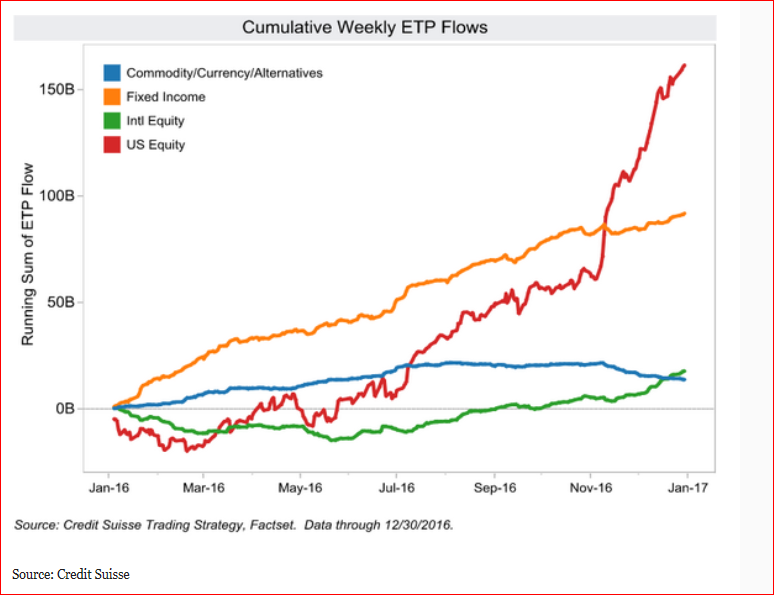
Just how giddy the financial markets have become is evident from the flows into electronic-traded-products (ETP) (Chart 1). While during the past year, prior to the election, bonds and stocks received relatively comparable inflows, post election, the flows into U.S. equities went almost vertical, and bonds tapered off along with commodities. Equities created what is now referred to as the “Trump rallyâ€.
Chart 1 ETP Flows
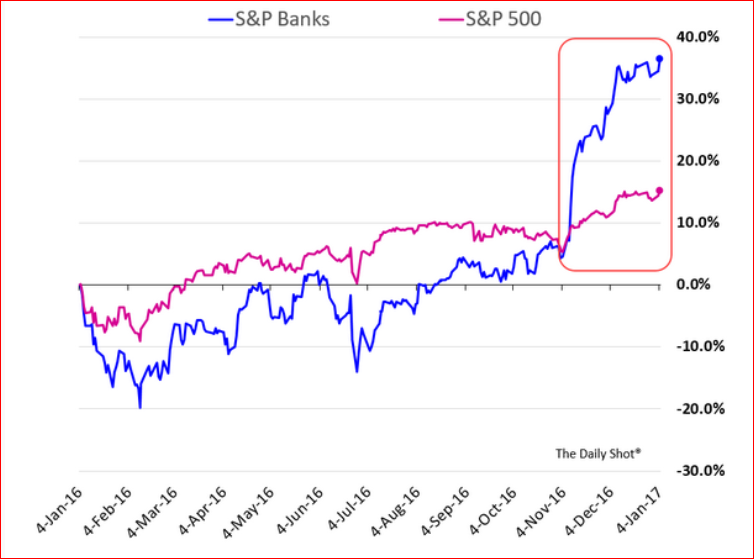
The leader of the pack is the S&P bank index as a proxy for the broader economy. Â Bank shares have been on a tear, increasing by nearly 40 per cent post-election (Chart 2). Bankers expect the Trump administration will boost growth and inflation, resulting in a steepening of yield curve that is the basis of bank profitability. At these valuation levels, investors are convinced that the future is already here, since these valuations are beyond historical averages.
Chart 2 S&P 500 and S&P Bank Shares
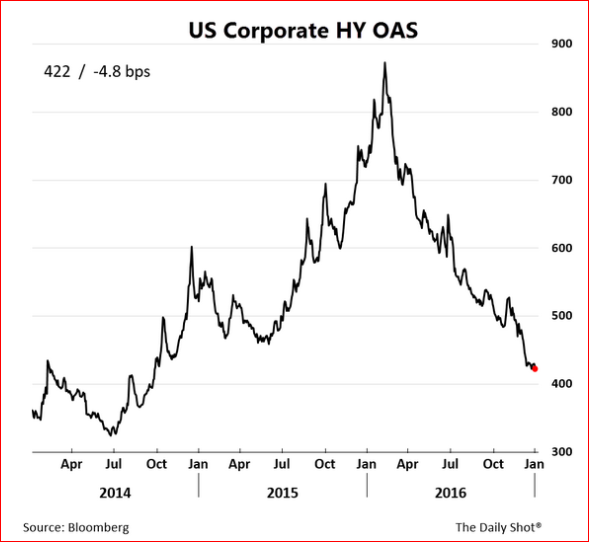
The credit markets have, by and large, bought into this future, especially in the case of corporate bonds. The spread on high-yield bonds, a proxy measure for the degree of risk-taking, has narrowed remarkably over the past twelve months (Chart 3). The spread plunged from nearly 900 bps in January, 2016 to less than 500 bps today. Investors have great confidence in the corporate sector growing in strength in this new environment and risk is definitely on.
Chart 3 HY Corporate Spreads
Finally, equity analysts are quite buoyant in their 2017 forecasts for corporate profits (Chart 4). After four straight quarters of declining earnings, the forecast for S&P earnings call for growth in the 10 per cent range and for the P/E ratios reaching 21 by year’s end. It seems that no asset class, with maybe the exception of U.S. Treasuries, will be left behind.
