I would like to update you on the US dollar as it plays such an important role in so many different markets. Getting the big trend right on the US dollar can help you see what areas are affected by the dollar to invest in. There are a lot of areas that have an inverse correlation to the dollar, such as commodities and the precious metals in particular.
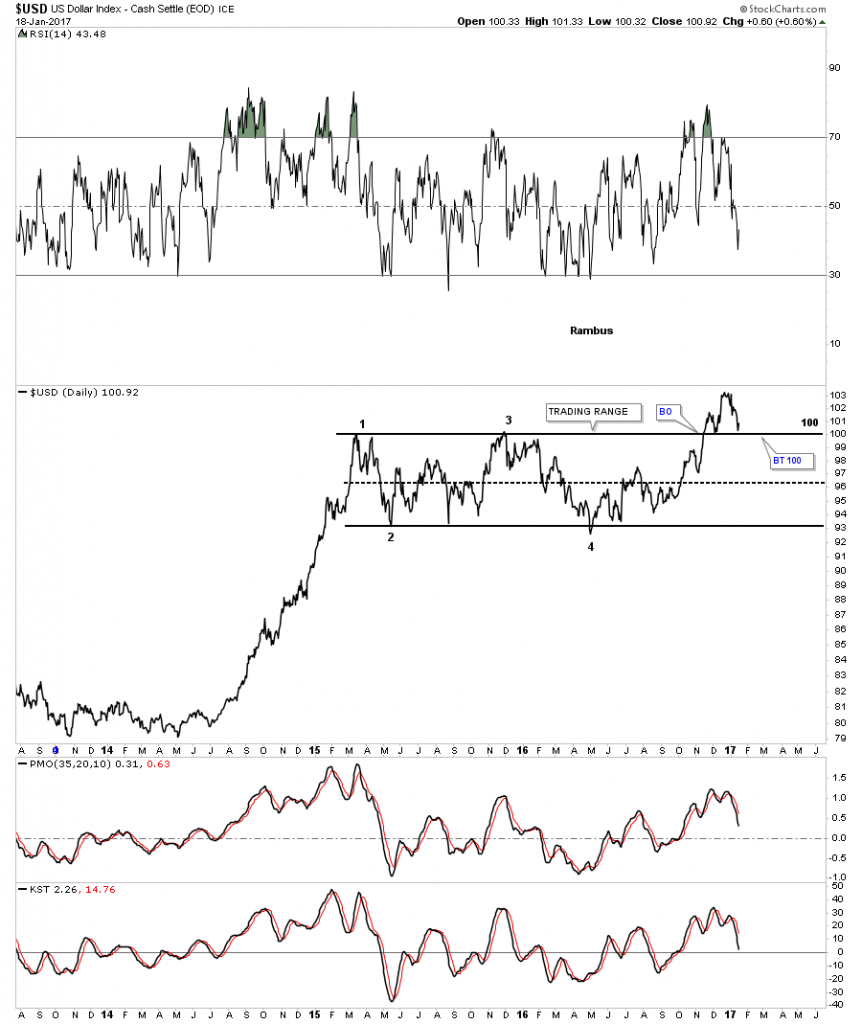
Let start with just with just a simple daily line chart that shows the two year sideways trading range with the breakout and the backtest that is currently underway. As you can see this is actually the 2nd backtest to the top rail at the 100 area so there is no question the top rail is hot.

This next chart for the US dollar is a daily bar chart which I’ve been showing as a rectangle consolidation pattern. If one were to connect the reversal point, #1 and #3 for the top rail, and reversal points #2 and #4 for the bottom rail, we would have an expanding falling wedge. The top rail would be sloping slightly down just a tad which would help in showing the backtest a little more clearly. The difference between the two would only be about a point or so. A good habit to get into when you see there may be a little morphing of a trendline is to tweak it, because it may be tested again at a later date.

Below is the updated version of the morphing rectangle halfway pattern which shows the nearly 2 year expanding falling wedge.The top rail is almost perfectly horizontal, but to get the backtest price objective right, every fraction of a point helps.

This is the first time I’ve shown this chart to you. Below is a weekly look at the US dollar which shows the blue expanding falling wedge and how it fits into the big picture as a halfway pattern to the upside. I’ve shown you many bull markets that form one consolidation pattern on top of the next, which can go on for years. When a bull market ends there is usually a recognizable reversal pattern that will build out which will signal a trend change. As long as the top rail of the blue expanding falling wedge holds support we have a consolidation pattern in place. Until the price action takes out the top rail to the downside we have a consolidation pattern, not a reversal pattern.
