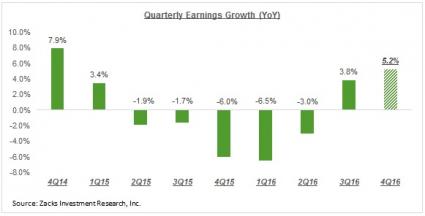
Corporate earnings have started growing again, with growth in the ongoing Q4 earnings season on track to reach its highest level in eight quarters. Growth is still modest – the Q4 earnings growth is currently on track to reach +5.2% and the final growth tally for the quarter will at best be a couple of percentage points higher. But this is still a notable improvement over what we were experiencing in the recent past.
Please recall that earnings growth turned positive only in 2016 Q3, having declined in each of the preceding five quarters, as the chart below of year-over-year earnings growth for the S&P 500 index shows.

Positive surprises, particularly on the earnings front, are tracking below other historical periods at this stage. We will see if this trend continues this week as we enter the heart of the earnings season, with more 400 companies coming out with quarterly results, including 106 S&P 500 members.
Q4 Scorecard (as of January 27, 2017)
We have crossed the one-third mark in the Q4 reporting cycle, with results from 170 S&P 500 members, or 33.9% of the index’s total membership, already out. Total earnings for these 170 index members are up +6.0% on +3.1% higher revenues, with 64.1% beating EPS estimates and 54.7% coming ahead of top-line expectations.
The table below provides the current Q4 scorecard

The charts below provide a comparison of the results thus far with what we have seen from this same group of 170 S&P 500 members in other recent periods.

As you can see, the Q4 growth pace is notably tracking above what we had seen from the same group of 170 index members in other recent periods. But positive surprises (right-hand chart above) are tracking on the low side at this stage, particularly on the earnings front. The 64.1% proportion of Q4 companies beating EPS estimates compares to 81.2% in the preceding quarter, 76.3% as the 4-quarter average and 72.2% as the 12-quarter average. Positive revenue surprises are tracking below what we had seen from the same group of companies in Q3, but are roughly in-line with historical periods.
The chart below compares the proportion of companies reporting Q4 results that are beating both EPS and revenue estimates with what this same group of companies had reported in other recent periods.

