GBP/USD continued to move higher last week, closing at 1.2944. This marked the highest weekly close since September 2016. This week’s key events are the PMI reports. Here is an outlook for the highlights of this week and an updated technical analysis for GBP/USD. Â
The pound ignored a weak GDP report, as UK Preliminary GDP softened to 0.3%, shy of the estimate of 0.4%. In the US, GDP grew by an annualized rate of 0.7% in the first quarter, weaker than expected and the lowest in three years.
Updates:
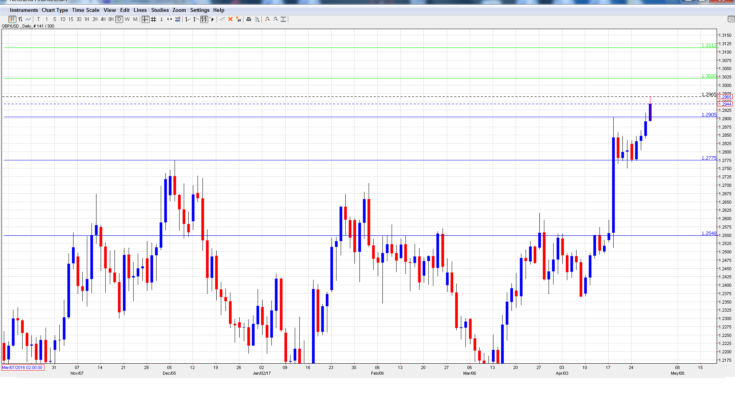
GBP/USD graph with support and resistance lines on it. Click to enlarge:

- Manufacturing PMI: Tuesday, 8:30:Â This is the first of three PMIs this week, which are important gauges of the strength of the British economy. Manufacturing PMI numbers have softened in Q1, but continue to indicate expansion. The estimate for March stands at 54.0 points.
- BRC Shop Price Index: Tuesday, 23:01. This indicator measures consumer inflation in BRC shops. The index came in at -0.8% in March, its smallest decline since December 2013.
- Construction PMI: Wednesday, 8:30. The indicator dipped to 52.2 in March, within expectations. Little change is expected in the April report.
- Services PMI: Thursday, 8:30. Services PMI improved to 55.0 in March, above expectations. The forecast for April stands at 54.6 points.
- Net Lending to Individuals:Â Thursday, 8:30. Consumer credit levels are linked to consumer spending, a key component of economic growth. The indicator edged up to GBP 4.9 billion in March, matching the forecast. The markets are expecting a weaker reading in April, with an estimate of GBP 4.5 billion.
*All times are GMT
GBP/USD Technical Analysis
GBP/USD opened the week at 1.2823 and quickly dropped to a low of 1.2770, testing support at 1.2775. It was all uphill from there, as the pair climbed to a high of 1.2965 (discussed last week). GBP/USD closed the week at 1.2944.

