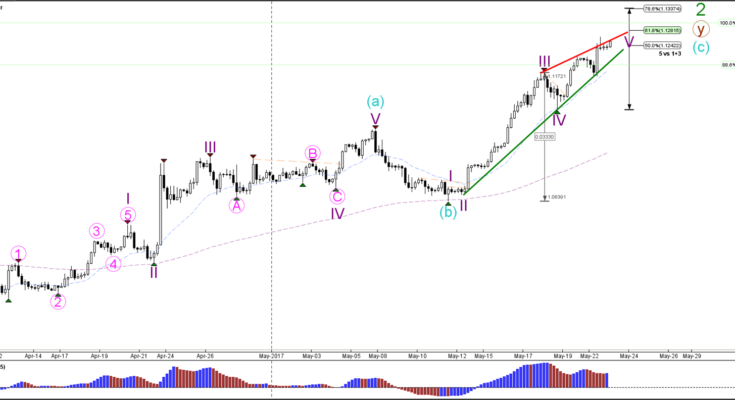
EUR/USD
4 hour

The EUR/USD is showing a bullish continuation within wave 5 (purple), which could complete a wave C (blue). The angle of the support (green) and resistance (red) trend lines are showing a rising wedge reversal chart pattern. However, considering the bullish price action the EUR/USD could test 1.13 first and break either way: above resistance or below support. A break above 1.13 invalidates the wave 2 (green) correction.
1 hour

The EUR/USD bounced at the 38.2% Fibonacci level of wave 4 (pink) and then broke above the resistance trend line (dotted red). A new 5 wave (pink) formation is most likely occurring within wave 5 (purple).
USD/JPY
4 hour

The USD/JPY bearish break below the support trend line (dotted green) could indicate a bearish continuation towards the next Fibonacci level which is the 78.6% at 109.50. However, a break below the support line connecting the candle bottoms might be needed before price can move down significantly.
1 hour

The USD/JPY is building a potential wave 4 (orange) correction and a wave 5 (orange) continuation before completing wave C (brown).
GBP/USD
4 hour

The GBP/USD could be building a wave 1-2 (grey) but this depends on whether price is able to break below the channel support (green/blue). A break above the orange trend line indicates the invalidation of wave 2 and the potential for an uptrend continuation.
1 hour

The GBP/USD break above the resistance (orange) invalidates wave 2 (grey) whereas a break below the support (blue) could indicate a bearish breakout.
Â

