EUR/USD
4 hour

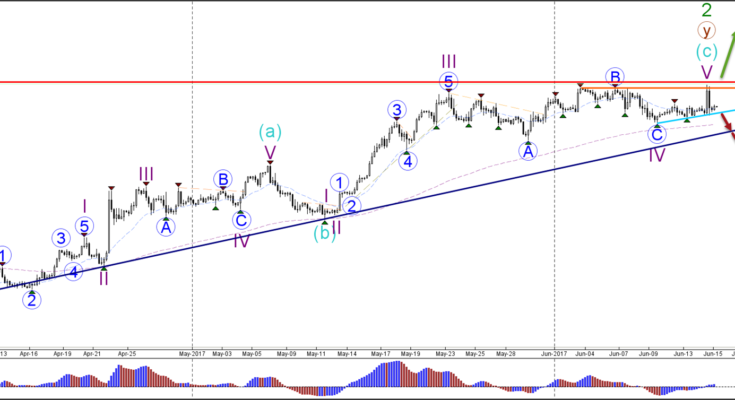
The EUR/USD challenged the key 1.13 resistance zone (red line) after weak inflation figures in the US were released yesterday. Despite the recent weakness in inflation levels, the US interest rates did increase from 1% to 1.25% later in the day which sparked a renewed US Dollar rally and hence a decline in the EUR/USD.
The EUR/USD is currently caught in between strong support and resistance and would need to break (arrows) these levels before a potential trend could start.
1 hour

The EUR/USD wave 4 (blue) becomes unlikely if price manages to break above the 61.8% Fib level.
GBP/USD
4 hour

The GBP/USD has retraced to the 50% Fibonacci level of wave 2 (blue) via an ABC zigzag (orange). A bearish breakout (red arrows) could confirm wave 3 (red). The GBP/USD wave 2 is invalidated if price breaks (green arrows) above the 100% Fibonacci level.
1 hour

The GBP/USD needs to break below support (blue/green) to confirm a potential wave 3 (blue). The Fibonacci levels of wave 2 (blue) could act as resistance.
USD/JPY
4 hour

The USD/JPY broke the support trend line (dotted blue) which has reopened the correction within wave B (brown). Price has reached the 88.6% Fibonacci level which is the last Fibonacci level of this wave B and a major bounce (green arrows) or break (red arrows) zone.
1 hour

The USD/JPY needs to break above resistance (red) for a potential bullish trend or break below support (green) for a potential bearish trend.
Â

