The EUR/JPY has been in a down move for the better of 2016.
The EUR/JPY peaked at around 141.00 at the end of May – beginning of June this year and since then it has been slowly creeping down achieving yearly lows of 109.40 during the Brexit vote. It goes without saying that we are in a strong down move. We are now at 113.25
Nevertheless, the Yen strength seems to have capped, and if we look at the J6U6 (September 2016 Yen Futures contracts) we can see that even though we are in a strong uptrend the 1.000 level has brought heavy sellers / long positions taking profit-making price stop and drop here. A point could be made that the Yen needs to breath before breaking through which would mean a drop to 0.9700 or even further to the 0.9500-0.9400 zone (U6J6). This would make for a stronger EUR/JPY in the short-mid term.
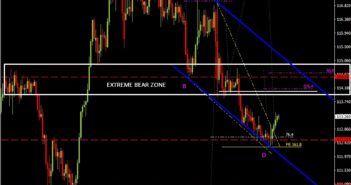
Now let´s take a look at the EUR/JPY chart. After testing the 118.00 level price dropped but has reacted to a previous structure high at around 112.00 wich is also the 76.4% of the entire move up and short targets at the 161.8 extension. For all fibonacci traders we also hit a perfect Gatley at this level (noted XABCD on the chart). Technicals shouted longs at the end of last week, we got in for an insanely good risk to reward ratio. Even though we might be riding a corrective move to a key bear zone around the 114.50 level which also happens to be the 50% of the AD leg we are gonig to see how price react to it and how the Yen trades.
If bears keep pounding the Yen the 114.50 might break and the down channel (blue structure) will be confirmed as a bull flag, a deep bull flag, and a test of the highs at the 117.50 might be possible. If not we will exit our longs and look for lower levels to go short, i.e., 111.00 and lower.


