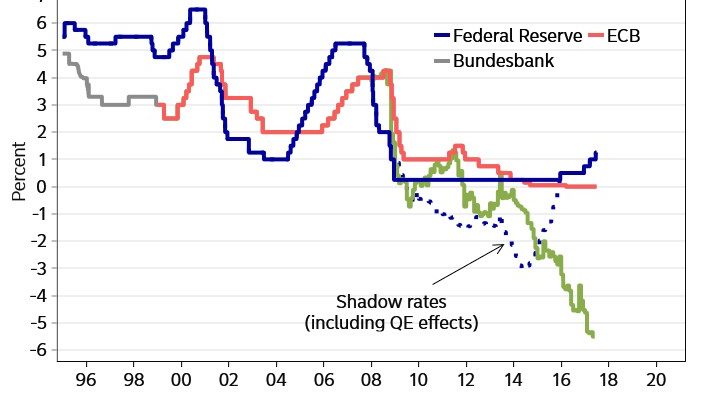
The chart below adds more depth to the traditional understanding of interest rates. This chart looks more confusing than it is because the grey line represents the Bundesbank policy before the ECB was created. The dotted line is the Fed’s shadow rate including QE and the green line is the shadow rate of the ECB which includes its QE. I have discussed previously the shadow rate of the Fed, but what I’ve never seen before is the shadow rate of the ECB. The ECB has the largest balance sheet out of all the central banks. It’s continuing its downward trajectory as there has been only a momentary unwind in 2013-2014. It’s nearing -6%. With such extraordinarily easy monetary policy, Draghi shouldn’t consider moderate growth and 1.4% inflation as a major win. This is a low bang for QE’s buck. It’s like getting a power washer to remove a leaf from a house. The policy hasn’t done much. Either QE isn’t a major factor for the economy or its masking massive weakness which will be renewed once the bond buying is tapered. We will see the results once the tapering accelerates in January 2018.

Economic Reports
The consumer expectations index was released from the Conference Board. It showed moderate improvement as you can see from the chart below. It went up from 117.6 to 118.9. The Present Situations Index rocketed to 146.3 from 140.6. As you can see, it is right where it was in 2007 before the financial crisis. The Expectations index fell from 102.3 to 100.6. The Present index breaking above the Expectations index might be a late cycle indicator as this also happened in 2007. The question is when the negative catalyst that consumers see will impact them. Maybe they don’t have faith that tax reform will pass.

On the negative side, the U.S. home prices index grew 5.5% in April which missed estimates for 5.9% growth. The S&P/Case Shiller index increased 5.9% in April of 2016 and 5.8% in March 2017. The managing director and chairman of the index committee said demand was rising and supply couldn’t keep up. The quote taken from him was “The question is not if home prices can climb without any limit; they can’t. Rather, will home price gains gently slow or will they crash and take the economy down with them? For the moment, conditions appear favorable for avoiding a crash.” I find it perplexing that he would bring up a crash with the Case-Shiller index showing such steady growth. Maybe he has recency bias by being nervous about a crash since the housing market just had a crash in 2008. It’s either that or he’s seeing something in the market that is more negative than the price action suggests.

