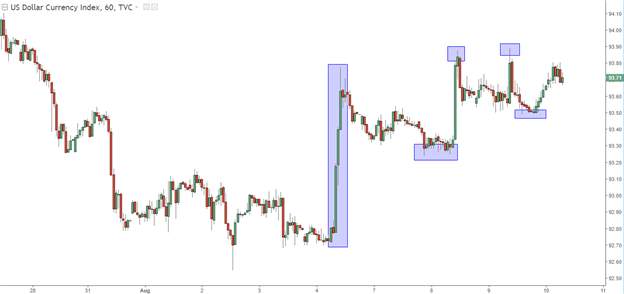
Earlier this week we looked at the U.S. Dollar after DXY had spiked-higher after last week’s NFP report. As we shared, this was likely in-part to a ‘short squeeze’ scenario, as a heavily oversold Dollar moved-higher on a rather solid NFP report. But in the half-week since, the Dollar has remained supported above prior lows; and traders have been bidding the Greenback to slightly higher-highs, giving the appearance of bullish price action in DXY, as shown below:
U.S. Dollar Hourly via ‘DXY’: Higher-highs & lows post-NFP

Chart prepared by James Stanley
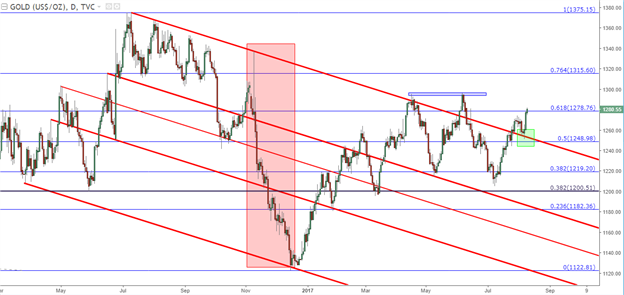
To be sure – Dollar strength hasn’t shown across all global markets, as metals have also been rather strong during this topside move. Gold has put in a significant burst over the past few days, and this would point to the fact that what we’re seeing likely isn’t dollar bulls enveloping price action in DXY; but rather unwind of previous trends on the basis of risk aversion.
Gold Daily: Gold Prices Breakout, Find Support on Topside of Bearish Channel

Chart prepared by James Stanley
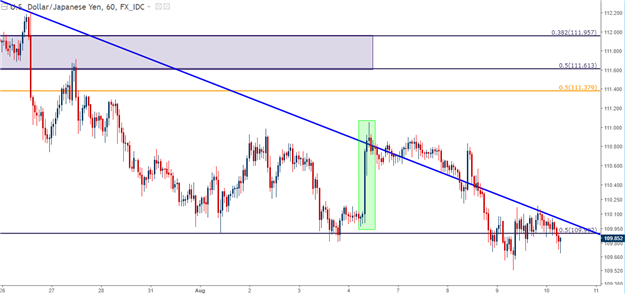
Also denoting the risk aversion nature of this recent move in the Greenback would be the fact that the Japanese Yen remains a bit stronger than the Greenback. If this were a legitimate move of USD strength as driven by the oncoming of USD-bulls, we’d likely see USD/JPY shooting-higher under the presumption that a dovish BoJ is unlikely to get hawkish anytime soon as inflation remains subdued in Japan. But the fact that this isn’t happening shows that we’re likely seeing unwind in USD/JPY, as well, as traders ‘tighten up’ to account for the greater degree of risk aversion.
USD/JPY Hourly: NFP Bounce Already Faded-Out

Chart prepared by James Stanley
Where the Dollar has begun to show strength has been against that previous high-flying trend in EUR/USD, and to a lesser degree, Cable. In EUR/USD, markets spent much of the period since mid-April pricing-in the prospect of higher rates out of Europe under the anticipation that the ECB would move away from their massive stimulus program at some point this fall. This led to a sharp topside move that saw little pullback, at least until now. On the hourly chart below, we’re looking at the bearish price action that’s shown in EUR/USD since last week’s NFP report.

