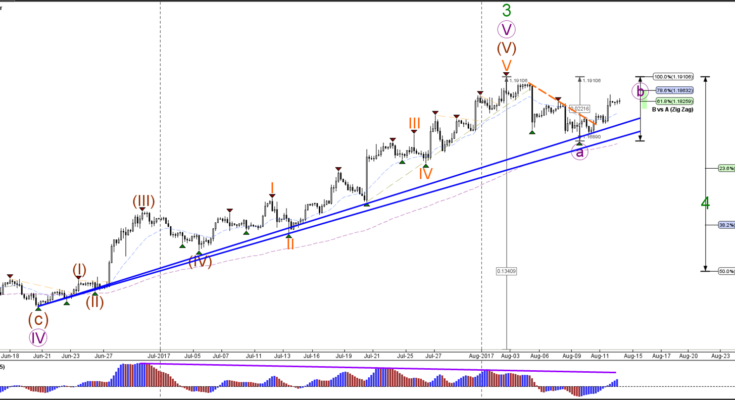
EUR/USD
4 hour

The EUR/USD divergence between the tops (purple line) could create a larger bearish retracement via an ABC correction (purple). A break of the top and 100% Fibonacci level of wave B vs A at 1.1910 could indicate an uptrend continuation.
1 hour

The EUR/USD potential break above the resistance (red) of the triangle chart pattern could see price move towards the next 78.6% Fibonacci level of wave B vs A whereas a break below support (green/blue) could see price complete wave B (purple) and start wave C.
USD/JPY
4 hour

The USD/JPY broke below the support trend line (blue) and could be building a downtrend continuation within wave C (brown).
1 hour

The USD/JPY could be building a wave 4 (orange) pullback if price manages to stay below the bottom of wave 1 (orange) which is indicated by the resistance trend line (red).
GBP/USD
4 hour

The GBP/USD broke above the resistance trend line (dotted red) and could be building a potential bullish retracement as part of a wave 2 (red). The red trend lines and Fibonacci levels could act as a resistance zone. The purple boxes are indicating a potential head and shoulders reversal chart pattern.
1 hour

The GBP/USD bullish breakout has probably started wave C (purple) of wave 2 (red).
Â

