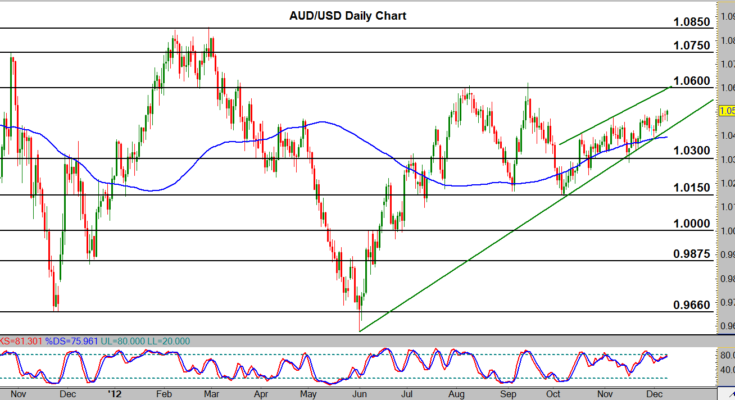
AUD/USD (daily chart) has sustained the bullish run that has been in place since the 1.0150 region low in October. This short-term bullish trend occurred after price established 1.0600 resistance in early August, then established 1.0150 area support in early September, then re-tested 1.0600 resistance in mid-September with a shooting star candle, and finally re-tested 1.0150 support in early October. After the latest bearish retracement down to 1.0150 in early October, price began the current bullish run that is outlined by a rising wedge pattern. Rising wedges can be considered potential bearish patterns if there is a downside pattern break. If this occurs, the key 1.0300 level could once again serve as potential intermediate support on a substantial move to the downside. The overall trend for AUD/USD, however, has been bullish from the June lows. A key level to watch in the event of continued upside trend momentum would be the 1.0600 level. In the event of a strong breakout above that level, which could confirm an uptrend continuation, price could move towards re-tests of further potential upside resistance around the 1.0750 and 1.0850 levels.
James Chen, CMT
Chief Technical Strategist
FX Solutions
Forex trading involves a substantial risk of loss and is not suitable for all investors. FX Solutions LLC (“FXSâ€) is compensated through a portion of the bid/ask spread. This information is being provided only for general market commentary (based on technical analysis) and does not constitute investment trading advice.  Certain information contained herein has been obtained from sources that FXS believes to be reliable; however, FXS cannot guarantee the accuracy of such information, assure its completeness, or warrant such information will not be changed. The information contained herein is subject to change without notice. FXS has no obligation to update any or all of such information; nor do we make any express or implied warranties or representations as to the completeness or accuracy or accept responsibility for errors. These materials are not intended as an offer or solicitation with respect to the purchase or sale of any financial instrument and should not be used as the basis for any investment decision. Past performance is not necessarily indicative of future results. No determination has been made regarding the appropriateness of any information contained herein. Due to various risks and uncertainties, actual events or results may differ materially from those reflected or contemplated herein. FXS expressly disclaims any loss or profits that may arise from any use of the information contained in or derived from this commentary. FXS and its affiliates may engage in transactions that are inconsistent with the views expressed herein. FXS does not endorse nor is it responsible for any third-party posts related to this material.


