EURUSD Daily Pivots
| R3 | 1.1098 |
| R2 | 1.1051 |
| R1 | 1.1017 |
| Pivot | 1.0907 |
| S1 | 1.0936 |
| S2 | 1.0889 |
| S3 | 1.0855 |

EURUSD (1.096): EURUSD posted three days of gains after a bounce off the support at 1.0825 and on the weekly charts, formed a strong pin bar. The intraday charts of EURUSD shows price breaking out of the minor trend line and a brief retest to the break out level at1.095. If this level holds, price is likely to move higher targeting 1.1135. Alternatively, a break below 1.095 will see EURUSD decline to test previous lows at 1.08.
USDJPY Daily Pivots
| R3 | 125.413 |
| R2 | 124.933 |
| R1 | 124.435 |
| Pivot | 123.955 |
| S1 | 123.475 |
| S2 | 122.995 |
| S3 | 122.497 |

USDJPY (123.97): With price struggling to break higher and already trading near all time highs, USDJPY looks likely for a dip lower to find support. The break below 124 is likely to seal this view, but a break of the steeper rising trend line is required to validate the move to the downside. Support comes in at 122 – 121.7 levels. The daily charts do not show any conclusive signs of a move to the downside, but a bearish close on the daily charts today could be an important signal to watch for.
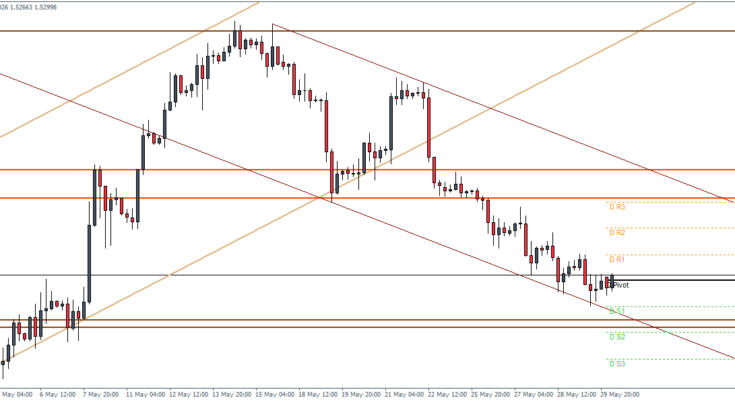
GBPUSD Daily Pivots
| R3 | 1.5446 |
| R2 | 1.5394 |
| R1 | 1.534 |
| Pivot | 1.5288 |
| S1 | 1.5234 |
| S2 | 1.5183 |
| S3 | 1.5128 |
GBPUSD (1.5299): GPUSD is trading near the support level on the daily charts at 1.5323 and 1.5237. A move higher from this level will likely see GBPUSD rally. In the intraday charts, price action is trading within the falling price channel’s lower trend line which is acting as support. The previous support at 1.545 is pending for retest of resistance which could become the first price level in the rally. To the downside a break below 1.52 is needed to see a continuation of the declines.


