EURUSD Daily Pivots
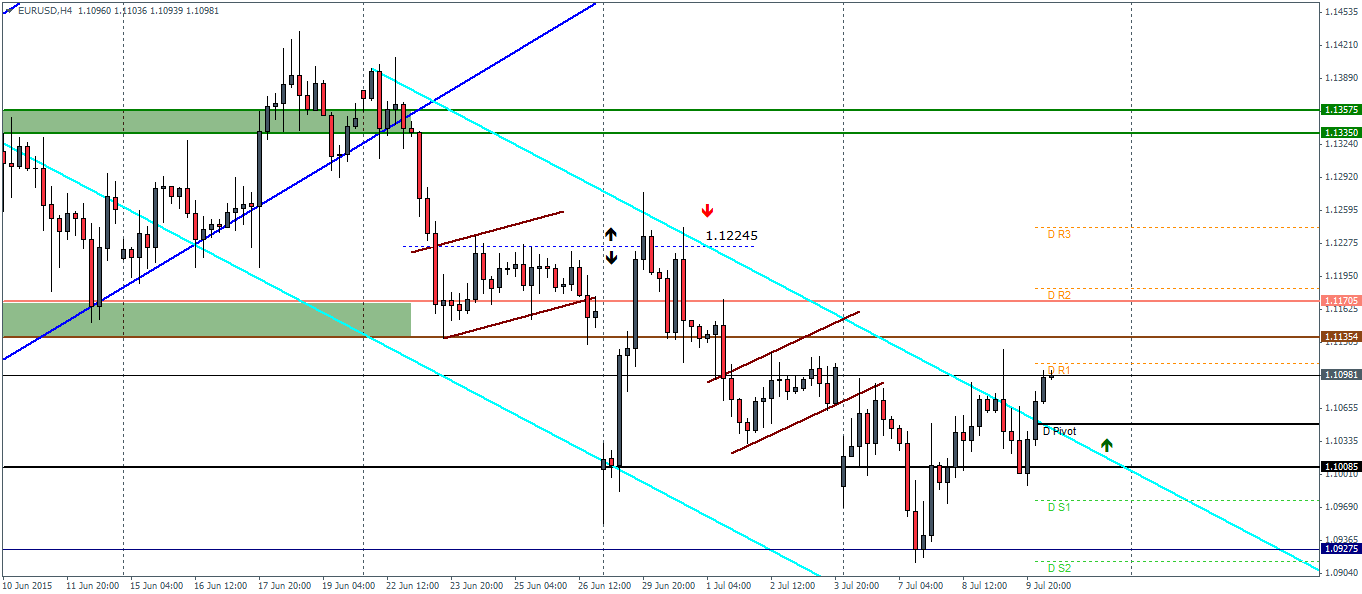
| R3 | 1.1242 |
| R2 | 1.1183 |
| R1 | 1.1109 |
| Pivot | 1.1049 |
| S1 | 1.1097 |
| S2 | 1.091 |
| S3 | 1.0841 |

EURUSD (1.11): EURUSD remains range bound from the highs and lows off June 29th. On the intraday charts, price has broken out off the re-adjusted falling price channel. We could expect a dip back to the break out level near the daily pivot at 1.105, following which EURUSD could rally towards 1.1135 – 1.117 region of support/resistance. To the downside a close below the previous support at 1.10085 could see the upside bias being invalidated and could decline lower towards 1.09275. A close above the support/resistance at 1.117 could shift the bias very bullish with an upside target to 1.1335.
USDJPY Daily Pivots
| R3 | 122.893 |
| R2 | 122.224 |
| R1 | 121.778 |
| Pivot | 121.123 |
| S1 | 120.664 |
| S2 | 120.008 |
| S3 | 119.562 |

USDJPY (121.8): USDJPY is posting a second day of gains from lows of 120.7. Price is back trading near the support resistance region of 122 – 121.7. If price fails to break above this level, USDJPY could fall back towards the previous support at 120.8. To the upside, a break above 122 is needed which could then shift the bias to the upside and also set USDJPY for a break out from the falling price channel. The breakout here could see USDJPY test the next resistance at 124.
GBPUSD Daily Pivots
| R3 | 1.5495 |
| R2 | 1.5458 |
| R1 | 1.5418 |
| Pivot | 1.5381 |
| S1 | 1.5342 |
| S2 | 1.5304 |
| S3 | 1.5265 |

GBPUSD (1.539): GBPUSD could see a modest bounce to the upside following a recovery yesterday. Price action however is seen to be consolidating on the intraday charts and could form a possible bearish flag pattern. If the bear flag is validated, GBPUSD will see a decline to the support at 1.52 region and lower. Alternatively, if prices head back into the falling price channel, we could see an attempt to test the overhead resistance at 1.551 – 1.5455.


