EURUSD Daily Pivots
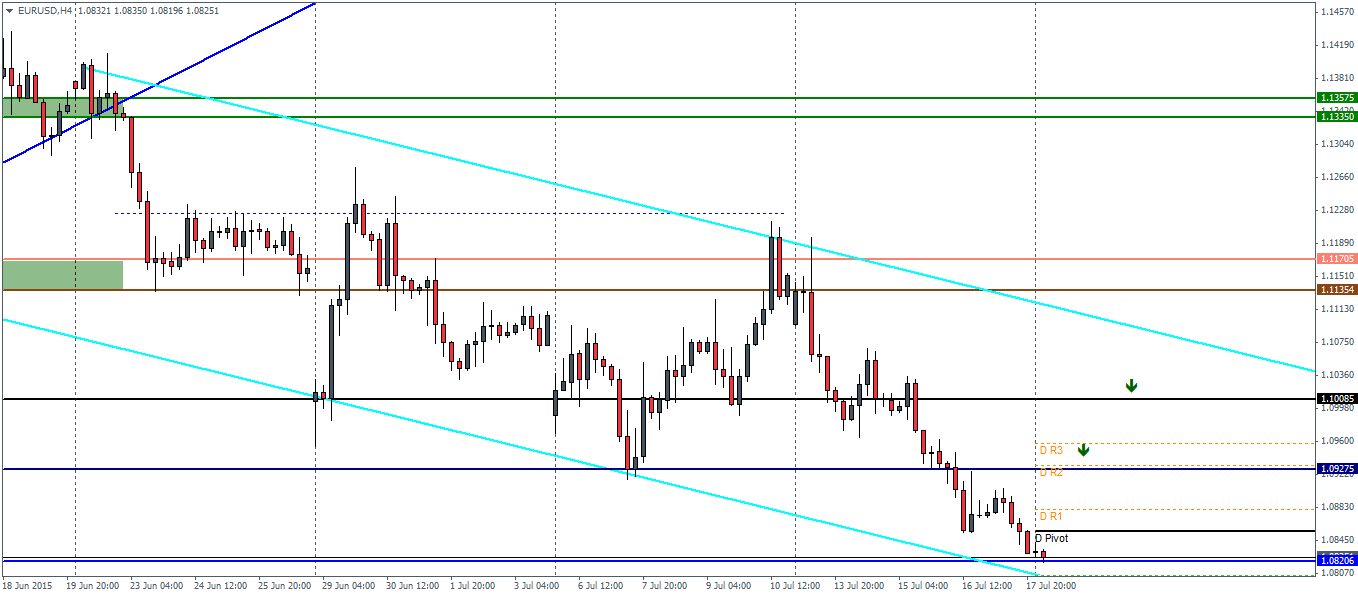
| R3 | 1.0955 |
| R2 | 1.093 |
| R1 | 1.0879 |
| Pivot | 1.0855 |
| S1 | 1.0803 |
| S2 | 1.0779 |
| S3 | 1.0728 |
 Â
Â
EURUSD (1.082): EURUSD closed Friday’s session near the support of 1.0825. This comes after three straight sessions of decline and thus, we could expect to see some kind of bounce in the near term. To the upside, resistance at 1.0974 remains untested and could be a potential price level for a bounce. On the intraday charts, we do have 1.10 as another level of support that gave way to the declines which could now turn to a potential test of resistance. With price trading within the falling price channel, the bias remains to the downside, unless we see a break out of some sort from the falling price channel.
USDJPY Daily Pivots
| R3 | 124.541 |
| R2 | 124.387 |
| R1 | 124.221 |
| Pivot | 124.067 |
| S1 | 123.912 |
| S2 | 123.757 |
| S3 | 123.603 |

USDJPY (124.1): USDJPY continues to tread along higher after breaking out from the falling price channel on the intraday charts and a major bull flag pattern on the daily chart. Price is seen to be currently consolidating near 124 and USDJPY remains biased to the upside with the next target at 125.6 most likely. In the unlikely event that USDJPY fails to be supported at 124, we could expect a decline down to 122.65 previous support/resistance level.
GBPUSD Daily Pivots
| R3 | 1.5781 |
| R2 | 1.5725 |
| R1 | 1.5664 |
| Pivot | 1.5610 |
| S1 | 1.5547 |
| S2 | 1.5492 |
| S3 | 1.5429 |

GBPUSD (1.559): GBPUSD has managed to find support near the previous support/resistance level of 1.551 – 1.5455. But price is trading within the falling price channel and looks to be consolidating at this point after a strong rally. We therefore expect an upside breakout from the falling price channel with resistance at 1.567. A break above this resistance will see a test back to 1.58. To the downside, prices are likely to be contained near the support/resistance level of 1.551 – 1.5455, but a break below this region could show renewed bearish momentum take shape.


