EURUSD Daily Pivots
| R3 | 1.1529 |
| R2 | 1.1457 |
| R1 | 1.1409 |
| Pivot | 1.1337 |
| S1 | 1.1290 |
| S2 | 1.1218 |
| S3 | 1.1170 |

EURUSD (1.13): EURUSD cleared the resistance level of 1.12845 on the daily charts and we expect to see a possible dip back to 1.12845 through 1.1348 to establish support in order to pave way for further upside. With prices trending sharply in the rising price channel, a decline to 1.1348 – 1.12845 could see prices test the next main level at 1.145 level of resistance which marked the previous high around 18th September. To the downside, in the event prices fail to establish support above 1.1348, we could expect to see a breakout from the rising price channel which could see prices test the next main lower support at 1.1254.
USDJPY Daily Pivots
| R3 | 120.961 |
| R2 | 120.656 |
| R1 | 120.452 |
| Pivot | 120.142 |
| S1 | 119.943 |
| S2 | 119.633 |
| S3 | 119.434 |

USDJPY (120): USDJPY remains range bound but with Friday’s candle closing on a bullish note, we could anticipate further upside in the near term on a close above 120.275. The next likely resistance level that could be tested comes in at 121. To the downside, there is a scope for prices to fall back to the lower support zone at 119.52 – through 119.4 region for another test to this level of support. Prices are currently trading below the 120.275 level of support resistance and a close above this level on the 4-hour time frame will signal a rally towards 121. To the downside, a breakout from the rising price channel could however see USDJPY look for another leg in its declines to 119.4 and to 119.145.
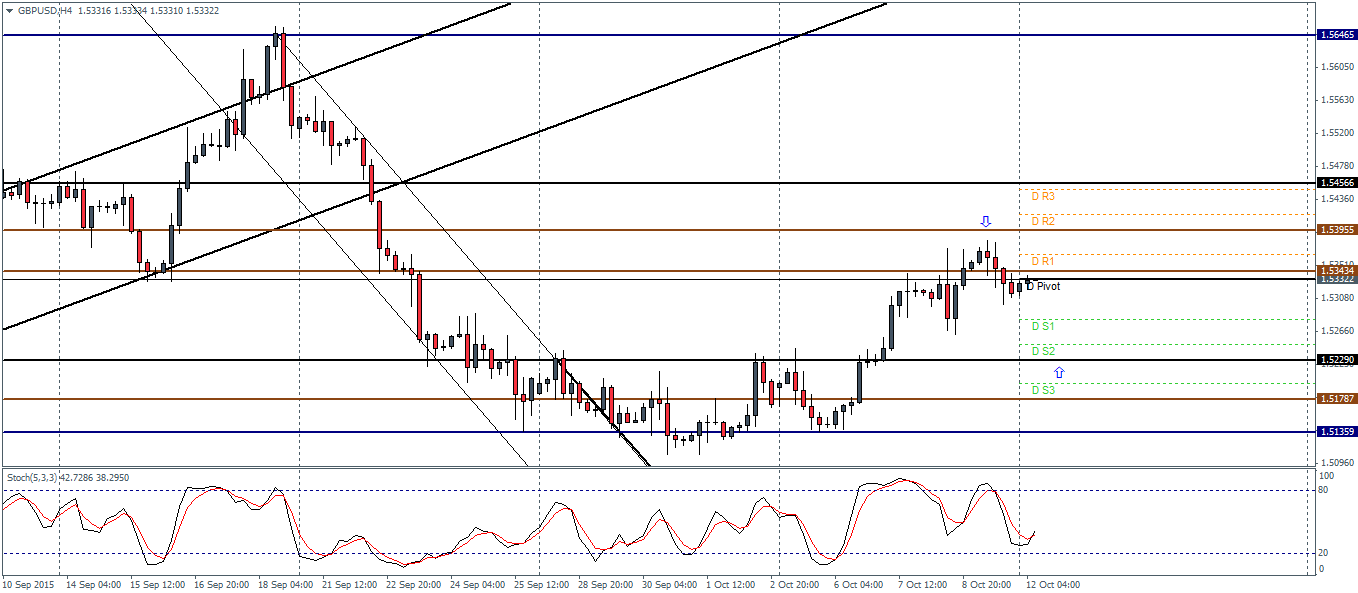
GBPUSD Daily Pivots
| R3 | 1.5447 |
| R2 | 1.5415 |
| R1 | 1.5364 |
| Pivot | 1.5332 |
| S1 | 1.5280 |
| S2 | 1.5248 |
| S3 | 1.5198 |

GBPUSD (1.53): GBPUSD is currently trading near 1.5334 level of resistance/support on the daily charts. A daily close, preferably with a bullish candle above 1.5334 is needed for a test to 1.5425. On the 4-hour charts, we can see that prices have managed to correct towards 1.5343 with a hidden bearish divergence being formed, comparing the highs of 1.5646 from 18th September and the most recent highs last week. Failure to rally above 1.5343 on the H4 chart will confirm a decline back to 1.5229.


