Crude oil has turned up in September after the price broke out of the triangle placed in wave (b), so final wave (c) with wave 4 pullback reached a 50.50 resistance where a sell-off occurred last week. Therefore, we suspect that WTI formed a new swing that will send the price down into wave 5 and back to 37.70.
Crude Oil, Daily

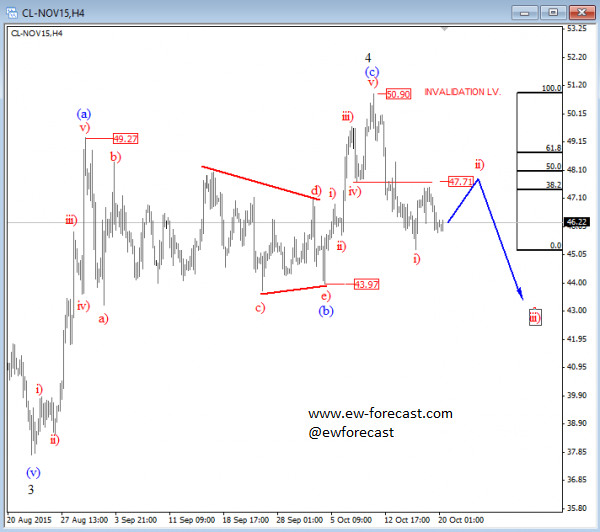
On the 4h chart, WTI crude oil has turned sharply lower from 50.90 where wave 4 accomplished a corrective retracement from the low. Notice that a move was made by three waves so it must be a temporary recovery, which is now complete. The reason is a recent fallback beneath the 47.70 swing support putting the highs in place. That said, we expect more weakness, especially after wave (ii) is completed around 48.00/48-50.
Crude Oil, 4h

A Triangle is a common 5-wave pattern labeled A-B-C-D-E that moves counter-trend and is corrective in nature. Triangles move within two channel lines drawn from waves A to C, and from waves B to D. Triangles are overlapping five wave affairs that subdivide into 3-3-3-3-3.
Basic Triangle Pattern:


