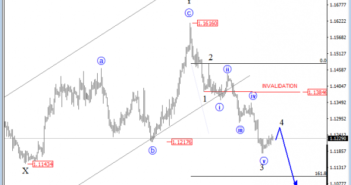
EURUSD is trading lower for the last few weeks, away from 78.6% Fibonacci level after that broken channel support line connected from wave X). In fact, the fall is quite sharp, so we are confident that it belongs to a bigger decline; thus a three wave drop down in wave D circled, that is part of a big triangle placed in wave IV.
EURUSD, Daily

On the lower time frame, EURUSD is trading nicely lower for the last few weeks and it has now the  shape of an impulsive decline underway, if we consider the sharp fall last week to 1.1200 area, which was our minimum downside objective. But the decline looks strong from the last few weeks, maybe it was the black wave 3. We will expect more downside after the current corrective bounce in wave 4 that may look for a resistance near 1.1260 early this week for a drop, then down to 1.1000 area as part of wave A of D within a triangle.
EURUSD, 4H

A Triangle is a common 5 wave pattern labeled A-B-C-D-E that moves counter-trend and is corrective in nature. Triangles move within two channel lines drawn from waves A to C, and from waves B to D. Triangles are overlapping five wave affairs that subdivide into 3-3-3-3-3.
A basic triangle pattern:


