USDCAD
USDCAD has been trading quite aggressively lower a few months back after a decisive break out of an upward channel connected from May of 2015 lows, which was an important evidence for a change in trend. That said, the price of USDCAD is likely to go even lower as the decline from 1.4680 has unfolded in five waves, labeled as wave A/I; first wave of a minimum big three waves of a decline. However, nothing moves in straight lines so we need to be aware of a corrective bounce up in wave B/II which is now already underway with still some room left towards 1.3700 area, since we expect a bigger corrective three wave recovery.
USDCAD, Daily

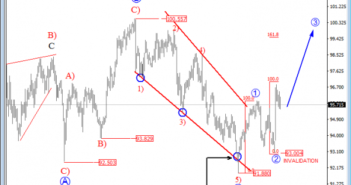
USD Index
On USD index daily chart we are observing a big sideways pattern since the start of 2015; it’s slow, sideways and overlapping price action which is a personality of a contra-trend movement that can be completed now. We see it as a flat correction in black wave IV; a three wave structure where the final wave C should be made by five waves. Well, we have seen a nice decline from November of 2015 counted in five legs, but as an ending diagonal. That’s a reversal pattern that already caused a strong bounce in May, so ideally the recent sharp leg down was just a pullback labeled as wave two within an ongoing uptrend and the recent sharp turn to the upside is undergoing wave 3, which could ideally reach 99 region.
USD Index, Daily


