EURUSD Daily Analysis
 Â
Â
EURUSD (1.110): EURUSD remains range bound with 1.110 proving to be a price level for consolidation. EURUSD is seen hovering around 1.110 for 11 consecutive days so far with prices staying flat. On the 4-hour chart, the consolidation has formed an inverse head and shoulders pattern which could be validated on a bullish breakout above 1.110. In this case, EURUSD could be seen extending gains close to 1.120. While this would invalidate the bearish flag pattern, on the daily chart, this could mark a retest of the previously broken support level. Forming resistance at 1.120 could signal a completion of the retest of resistance paving the way for a larger decline.
USDJPY Daily Analysis

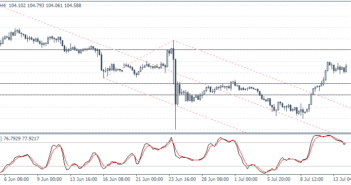
USDJPY (104.58): USDJPY retraced some of its declines yesterday, but prices closed with a small range yesterday above 104. The consolidation is likely to see USDJPY turn flat within 104 and 102 levels. In the very near term, another test to 105 cannot be ruled out; following which USDJPY could be looking weaker to the downside. Establishing support at 102 could potentially signal a confirmation of a bottom being formed in USDJPY and prepares for a longer term move to the upside.
GBPUSD Daily Analysis

GBPUSD (1.318): GBPUSD turned bearish yesterday near 1.320 with prices currently seen testing this level. In the near term, GBPUSD could be seen sliding back to 1.30 which could act as a short term support. This potentially points to GBPUSD looking to test 1.38 price level to establish resistance. To the downside, a break down below 1.30 could signal further declines in the GBPUSD. Price action has comfortably broken out from the falling wedge pattern with 1.32 coming in as a strong barrier for prices so far.
Gold Daily Analysis

XAUUSD (1339.56): Gold prices closed bullish yesterday following the previous two days of declines. With 1350 level being breached, the upside is likely to stay limited close to this level. Establishing resistance at 1350 could, however, signal further downside to 1300. On the 4-hour chart, price action is seen to be bearish currently following the previous doji close. In the near term 1350 – 1327.50 remains the levels that gold could remain trading within.


