USDCAD is still trading quite aggressively lower after the price made a sharp reversal to the downside from 1.468 area, where the price completed a higher degree bullish structure. That said, the price of USDCAD is likely going even lower as the decline from 1.4680 has unfolded in five waves, labeled as wave A/I; first wave of a minimum big three waves of a decline. However, nothing moves in straight lines so we need to be aware of a corrective bounce up in wave B/II which is now already underway with still some room left towards 1.3700 area since we expect a bigger corrective three wave recovery.
USDCAD, Daily

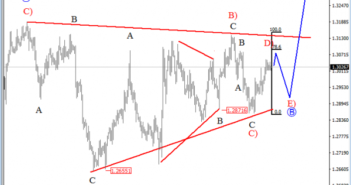
On the lower time frame, USDCAD has been trading slightly lower last week from the upper side of a trading range so it appears that wave B correction is still unfolding. We are looking at a triangle currently with the price moving up into wave D, but wave E) is still missing. As such, the pair will likely stay trapped in a range for a few more sessions, before a new impulsive wave may lift pair up to 1.3500 area.
USDCAD, 4H

Â
A Triangle is a common 5 wave pattern labeled A-B-C-D-E that moves counter-trend and is corrective in nature. Triangles move within two channel lines drawn from waves A to C, and from waves B to D. A Triangle is either contracting or expanding depending on whether the channel lines are converging or expanding. Triangles are overlapping five wave affairs that subdivide 3-3-3-3-3.
Basic Triangle Pattern:


