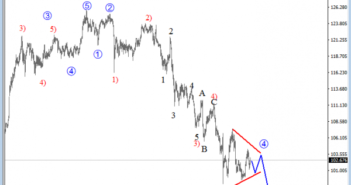
On the daily chart of USDJPY we are observing a nice impulsive decline taking place, with the price now trading in one of its temporary corrective sub-waves, wave 4-circled. If that is the case, then the current sideways price action could suggest that we are dealing with a triangle correction, a continuation pattern that can push the price to 96.00 area, once the pattern is complete.
USDJPY, Daily

On the 4h chart we see that USDJPY had turned nicely down from above 104.00 level this month, where we see a completed wave C) that belongs to a big triangle formation which is also visible on a daily chart in the middle of a bearish impulsive trend. So we will expect more weakness on this pair, down to 98.00 level but firstly we need to count a completed correction in the current blue wave 4-circled. That’s not the case yet as we need five sub-waves from end of June. On our 4h chart we can see the current turn down as wave D), so wave E) should also show up before we may focus on a new strong bearish leg; wave 5-circled in our case. In the short-term traders may see a drop to around 100.00-100.50 support area.
USDJPY, 4H

A Triangle is a common 5 wave pattern labeled A-B-C-D-E that moves counter-trend and is corrective in nature. Triangles move within two channel lines drawn from waves A to C, and from waves B to D. A Triangle is either contracting or expanding depending on whether the channel lines are converging or expanding. Triangles are overlapping five wave affairs that subdivide into 3-3-3-3-3.
Basic Triangle Pattern:


