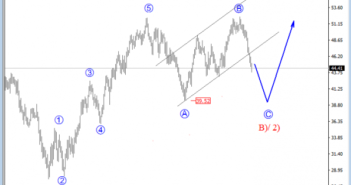
The sharp decline on crude oil suggests that the market can see more weakness now in wave C of B/2, especially after the recent broken channel line connected from 39.50. That said, we are now looking at a more complex corrective decline from 2016 highs, but still a contra-trend movement that will be expected to send this market higher again once the flat correction is finished.
Crude OIL, Daily

Regarding the 4h chart, Crude oil is turning significantly lower, now trading well beneath the trendline support connected from 39.50 August low, which opens the door for more weakness as the price action, from the last few days, is looking quite impulsive.
We see a current price in the middle of an extended red wave 3), currently, with subwave four pullback that can achieve the 45.88 resistance area from where next leg down may occur.
Crude OIL, 4H

A Flat is a three-wave pattern labeled A-B-C that generally moves sideways. It is corrective, counter-trend and is a very common Elliott pattern.
Basic Flat Pattern:


