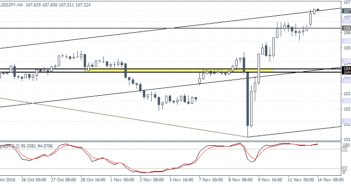
USDJPY Daily Analysis
 Â
Â
USDJPY (107.52): The US dollar is seen approaching the critical resistance level of 108.00 with the bullish momentum seen being maintained after Friday’s hammer candlestick pattern. Still, the Stochastics Oscillator on the daily chart points to a hidden bearish divergence which could see the dollar ease back towards 104.00 where support needs to be established. Look for USDJPY to close below 106.65 which will confirm the downside bias towards 104.45 – 104.60.
NZDUSD Daily Analysis

NZDUSD (0.7083): NZDUSD extended its declines since last Wednesday’s RBNZ rate cut decision. The kiwi broke down below 0.7235 – 0.7236 minor support and is seen testing the neckline support. Horizontal support is seen at 0.7046 which could be challenged, but bounce off this support cannot be ruled out. Look for a near term retracement back to 0.7235 – 0.7236 ahead of further declines. Below 0.7046, minor support is seen at 0.6982 followed by a longer-term decline towards 0.6669.
GBPJPY Intra-day Analysis

GBPJPY (13481): GBPJPY continues to consolidate above the 134.30 handle, but no significant highs have been formed as of yet. Support is seen near 134.30 – 133.72 region and a breakdown below this support could trigger further downside towards 131.65 support followed by 130.50 – 130.20 lower support. On the 1-hour chart time frame, the Stochastics also points to a bearish divergence, failing to confirm the current highs in price and indicating a near-term correction lower.


