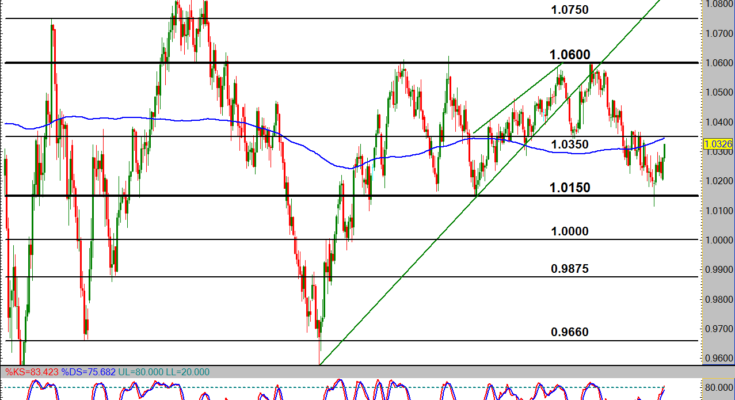
AUD/USD (daily chart) as of March 12, 2013 has continued its rise from major support within the wide, 8-month trading range. This climb began on a key hammer candle last week that indicated yet another upside turn from strong support around 1.0150. Since July 2012, the clear horizontal trading range has confined price between this 1.0150 downside support and 1.0600 upside resistance. The pair has rebounded between these levels at least four times for each level within the past 8 months.
Last week was no different. Advancing from the well-formed hammer candle at 1.0150 support, price has now approached intermediate resistance around 1.0350. This level not only represents a prior support/resistance pivot zone, but the 200-period simple moving average is also currently right around this price area. In the event of a breakout above this resistance confluence, price could make a medium-term move back to the upside towards the top border of the trading range around 1.0600.
James Chen, CMT
Chief Technical Strategist
City Index Group
Forex trading involves a substantial risk of loss and is not suitable for all investors. This information is being provided only for general market commentary and does not constitute investment trading advice. These materials are not intended as an offer or solicitation with respect to the purchase or sale of any financial instrument and should not be used as the basis for any investment decision.


