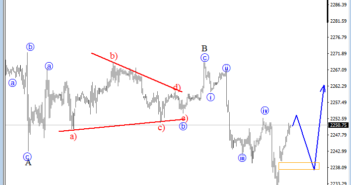
E-mini S&P500 is turning up from 2227 where the price structure shows signs of a completed A-B-C movement; known as a flat correction. We expect a continuation higher, but that open gap near 2237 suggests that we may see a pullback and then a strong push up.
S&P500, 1H

If there is any pair to short US dollar then it’s USDCAD which can be turning down with 5 waves from the high. For now, this is not confirmed yet, but new lows from the current sub-wave 4 would suggest that the pair is in a new bigger bearish cycle that should continue after wave 2)/B).
USDCAD, 1H


