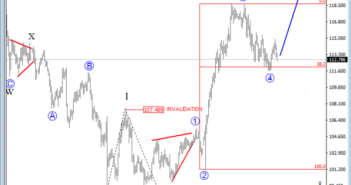
USDJPY is showing a nice example of the wave principle in motion, a higher degree impulse. At the moment we see the price trading at the beginning of blue wave five, after some corrective movement had come in play in the previous blue wave 4. That said as we can see on the chart, the 38.2 Fibonacci ratio may have just prove to be a nice region for support, so more upside may follow in the weeks ahead.
USDJPY, Daily

On the 4h chart of USDJPY, we can see a nice strong bullish turn taking place from around the 111.60 level, where we labeled the end of a complex correction. As such, recent recovery gives us an indication for a completed double zig-zag correction and a suggestion that higher levels will now follow while the market stays above 111.60. At the moment we see the price trading up from black wave 2, that seems to have found a base at the 61.8 Fibonacci ratio.
USDJPY, 4H


