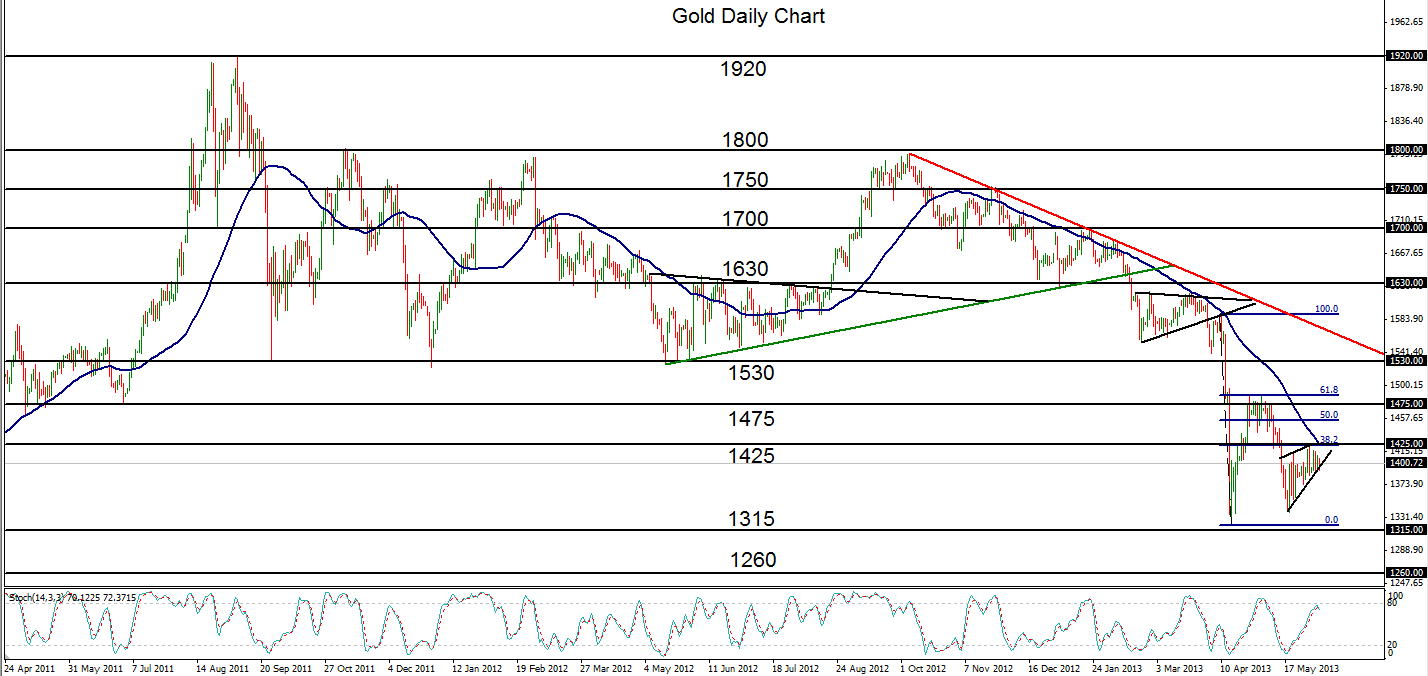

June 6, 2013 – Gold (daily chart) has formed a rising wedge consolidation pattern within an overall bearish trend. This chart pattern hints at a potential impending breakdown which could continue the downtrend that has prevailed since the highs around 1800 eight months ago.
During the course of this downtrend, a sharp decline within the span of just a few days in mid-April dropped price down to a long-term low of 1321. After this swift plunge, gold corrected back up in late April and early May to a high around 1487, which coincided with the 61.8% Fibonacci retracement of the sharp decline. After this rise to the major Fib level, price fell once again to form the current wedge consolidation pattern that has respected key resistance to the upside around 1425, which is also the 38.2% Fibonacci retracement of the sharp decline.
Provided gold is able to stay below this 1425 resistance level, the key price event to watch for would be a significant break below the rising support line of the wedge consolidation pattern. In the event of this breakdown, major price objectives to the downside include a retest of the 1320-area low, and then further down towards bearish targets around 1265 and 1160.
James Chen, CMT
Chief Technical Strategist
City Index Group
Forex trading involves a substantial risk of loss and is not suitable for all investors. This information is being provided only for general market commentary and does not constitute investment trading advice. These materials are not intended as an offer or solicitation with respect to the purchase or sale of any financial instrument and should not be used as the basis for any investment decision.


