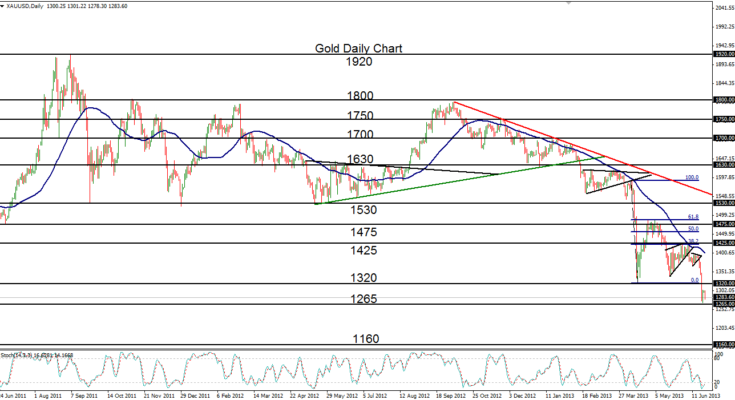
June 24, 2013 – Gold (daily chart) has stalled its continued decline right above key support around the 1265-70 price region. The drop to last Friday’s low at 1269 established a 33-month low for the precious metal, extending the substantial bearish trend that has been in place since the October 2012 highs near 1800. Last week’s dramatic plunge broke down below an inverted pennant pattern which foreshadowed the continued bearishness in gold. That drop extended into a swift breakdown below the previous 1321 low that was established in mid-April. With gold now hovering above the noted 1265 support area, price is at a critical juncture. From a bearish trend perspective, a breakdown below 1265 would confirm a downtrend continuation with a potential downside support objective around 1160. Intermediate resistance now resides around 1320 previous support.
James Chen, CMT
Chief Technical Strategist
City Index Group
Forex trading involves a substantial risk of loss and is not suitable for all investors. This information is being provided only for general market commentary and does not constitute investment trading advice. These materials are not intended as an offer or solicitation with respect to the purchase or sale of any financial instrument and should not be used as the basis for any investment decision.


