For the past few weeks, I’ve been having a debate about whether we are near a peak in growth that would continue to weaken the stock market.
This is an especially important conversation for two reasons:
1) the economic and earnings growth have been very good in the past year, making an astute investor wonder if this is “as good as it gets.”
2) we are headed into a period of rising interest rates as inflation finally shows signs of life. Here are some of those articles and videos for your review…
Has the Stock Market Topped Already?
The Not-Good-Enough-Yet Earnings Season
Today, after we entered the heart of earnings season with nearly 1/3 of S&P members having reported this week, I want to update some of the corporate profit projections I’ve been showing you.
I will present 4 graphs from the weekly update of our Director of Research, Sheraz Mian.
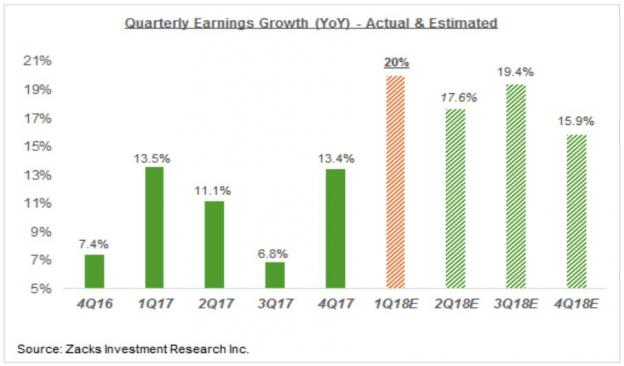
The first graph is quarterly earnings growth (year-over-year, which compares a given quarter to the same quarter in the previous year) for the S&P 500 since Q4 2016. What you see are the actual growth rates through Q4 2017, the current picture in Q1, and the estimates for the rest of 2018…

A few things stand out here. First, the current Q1 picture has risen dramatically in the past 2 weeks since I compiled the data for my article Has the Stock Market Topped Already? from 16% to 20% growth.
This is simply based on the number and magnitude of earnings “beats,” or upside surprises.
Second, the remainder of the year’s estimates in Q2 through Q4 haven’t changed much and still show a very positive picture of strong year-over-year growth. The difference, again, is that Q1 could end up being a peak in the growth rate vs an expected peak in Q3.
Third, Technology and Finance are big contributors to this profit outlook (as we will discuss), and even a recovering Energy sector is helping.
The rate of change of growth is certainly paramount because it speaks to how fast conditions are improving, or deteriorating. But another way to view record corporate profits in a steady-as-she-goes 2-3% GDP economy is through the total cash piling up…

