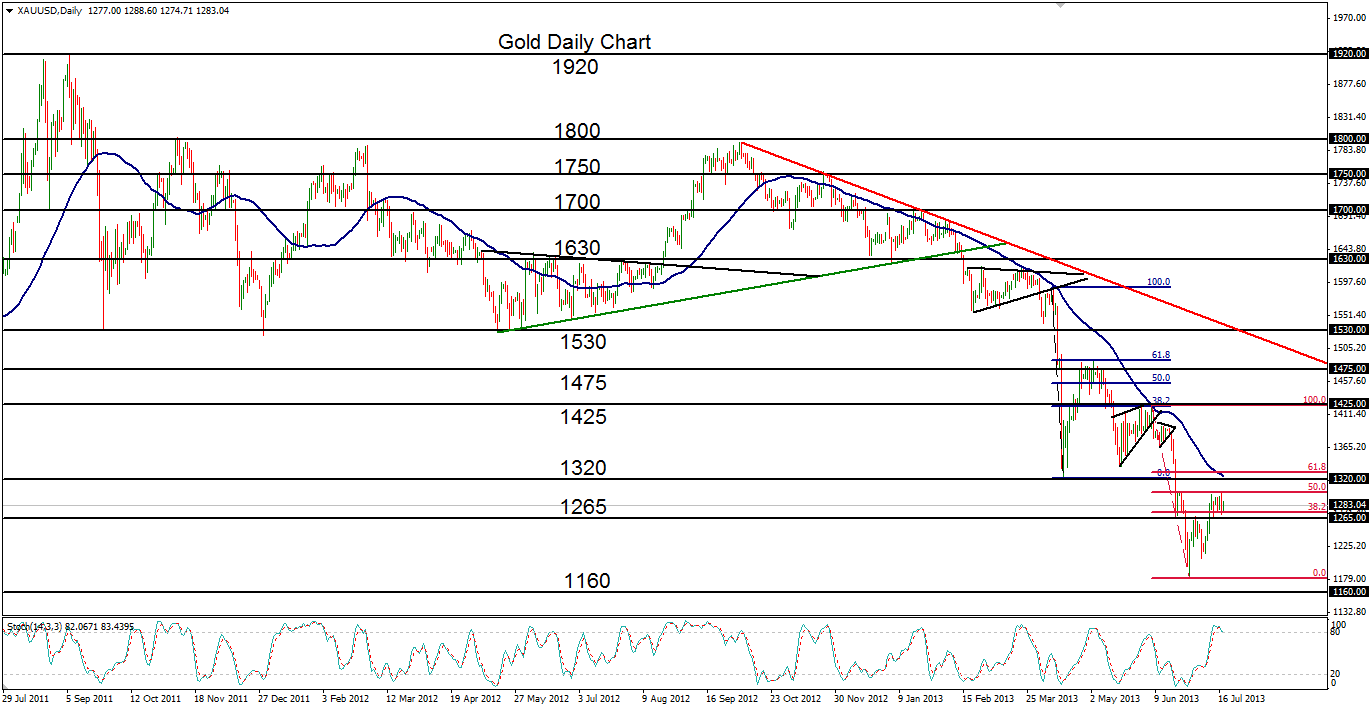

July 18, 2013 – Gold (daily chart) has stalled within a tight flag-like consolidation after rising modestly in the past three weeks from depths as low as 1180 in late June. That trough represented almost a three-year low for the precious metal, closely approaching a support level around 1160 that was last hit in mid-2010. The attempted recovery of the past three weeks has thus far brought price back up to around the 50% Fibonacci retracement of the plunge from around the important 1425 resistance level down to the noted 1180 long-term low. In the process, price has recovered above the key 1265 support/resistance level.
Having just formed a small flag consolidation pattern, gold would need to breakout significantly above the high of this pattern around the 1300 level if it is to confirm a continuation of the current upside correction and recovery. In this event, a key intermediate price objective to the upside resides around the noted 1425 level. Any strong breakdown below current support around the 1265 level could likely invalidate or delay the recovery.
James Chen, CMT
Chief Technical Strategist
City Index Group
Forex trading involves a substantial risk of loss and is not suitable for all investors. This information is being provided only for general market commentary and does not constitute investment trading advice. These materials are not intended as an offer or solicitation with respect to the purchase or sale of any financial instrument and should not be used as the basis for any investment decision.


