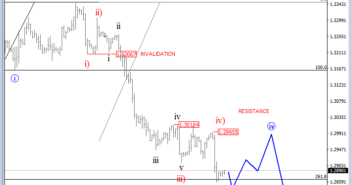
USDCAD is making a nice and clear bearish structure away from the 1.3348 level, where the corrective blue wave ii was completed. That said the current bearish development now suggests that blue wave three is in progress and can reach the Fibonacci projected level of 261.8%, from where bears can slow down and a new temporary rally into blue wave four can follow. Ideally the mentioned wave four will later see limited upside around the former fourth waves near the 1.2996/1.3015 region from where a new drop can follow.
USDCAD, 4H

USDJPY is in a nice recovery since mid-June when the market turned up from 108.80 after a completion of a bigger three wave fall. That said as we can see the bulls took charge and could be now unfolding a bigger impulsive structure. We see first waves one and two completed, which means recovery up from 110.95 level can be blue wave three in the making, that can extend towards the Fibonacci projection zone at 161.8 in the next couple of days.
USDJPY, 4H


