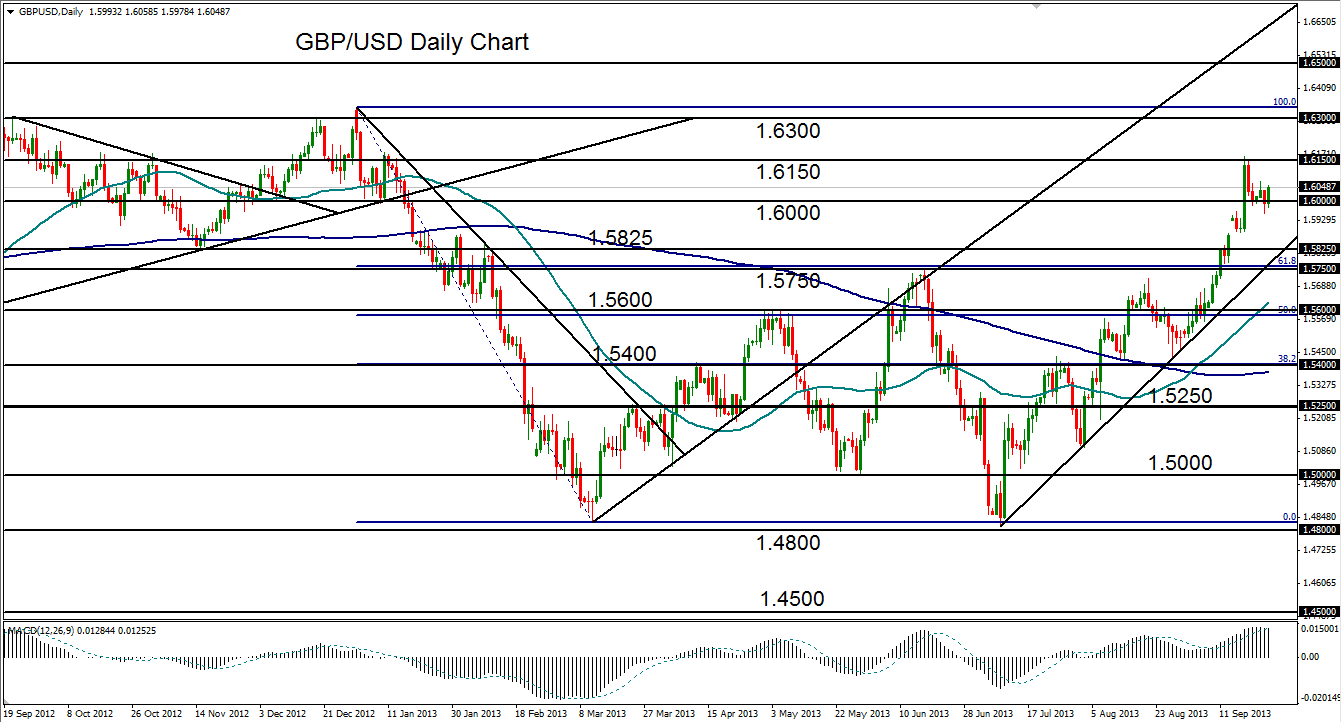

September 25, 2013 – GBP/USD (daily chart) continues to trade in a relatively tight range just above the 1.6000 psychological level after coming off the 8-month high of 1.6161 that was established just one week ago. This range represents a pullback/consolidation within the context of the steep bullish trend that has been in place since the double-bottom reversal from the 1.4800 price region in July. Since the noted 8-month high was reached mid-week last week, the pair has fluctuated within a flag/pennant-like pattern consolidation between 1.6150 resistance and 1.6000-area support, and appears to be building up for a potential breakout.
If it is a true flag/pennant pattern, the bias is towards a trend continuation to the upside on a pattern breakout, which would have a primary price objective around the major 1.6300 resistance region. In contrast, an extension of the current pullback would be indicated on a substantial breakdown below 1.6000, which could drop price back down towards key support around the current uptrend support line and the 1.5750-1.5825 support zone.
James Chen, CMT
Chief Technical Strategist
City Index Group
Forex trading involves a substantial risk of loss and is not suitable for all investors. This information is being provided only for general market commentary and does not constitute investment trading advice. These materials are not intended as an offer or solicitation with respect to the purchase or sale of any financial instrument and should not be used as the basis for any investment decision.


