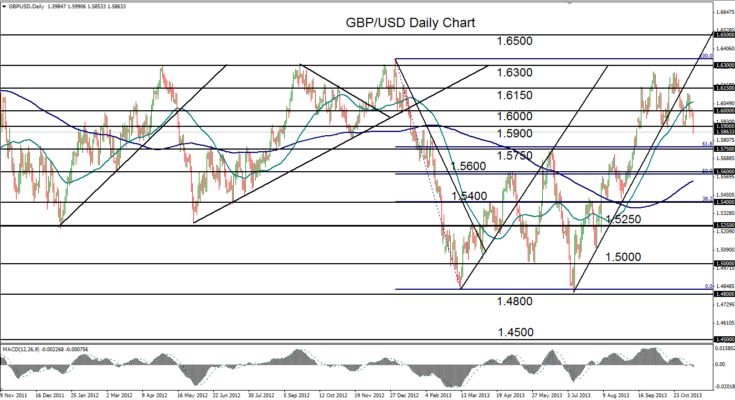
November 12, 2013 – GBP/USD (daily chart) has dropped to break down tentatively below key support at 1.5900, a level that has been tested and respected at least twice within the past month. From mid-September, the currency pair was entrenched in a well-defined trading range, establishing strong resistance around 1.6260 with a double-top pattern, and strong support around 1.5900 with a double-bottom pattern. Now that the pair has furthered its losses by tentatively breaking down below the 1.5900 support level, the double-top reversal pattern that potentially reverses the steep July-October bullish trend has theoretically been validated. With the current breakdown in place, the clearest immediate support target to the downside resides around the key 1.5750 level, followed by 1.5600. In the event of a short-term upside pullback above 1.5900, strong resistance should be found around the 1.6000 psychological level.
James Chen, CMT
Chief Technical Strategist
City Index Group
Forex trading involves a substantial risk of loss and is not suitable for all investors. This information is being provided only for general market commentary and does not constitute investment trading advice. These materials are not intended as an offer or solicitation with respect to the purchase or sale of any financial instrument and should not be used as the basis for any investment decision.


