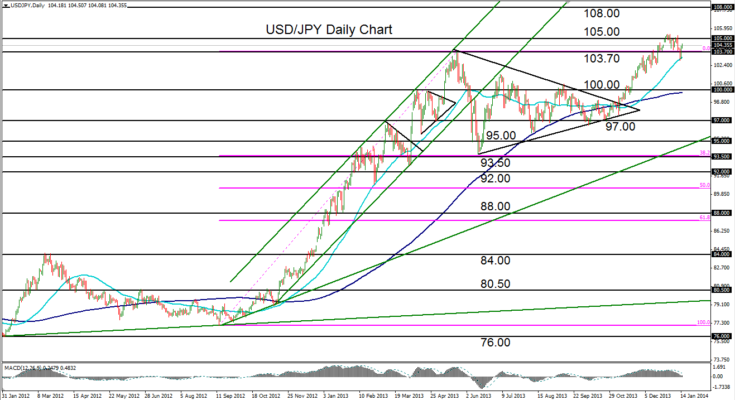
January 15, 2014 – USD/JPY (daily chart) has rebounded off its 50-day moving average after having pulled back in the past few trading days down to a low of 102.85. This pullback occurs within the context of a strong and steep bullish trend that has been in place for the past two months, and from a broader perspective, since September 2012.
The most recent bullish run began on a breakout above a large triangle pattern in early November, which advanced beyond the prior high of 103.72 (May 2013) to hit a five-year high of 105.43 at the very beginning of 2014. Since that high was established, the pair has made the noted pullback – the most significant one since November.
Having just rebounded off its 50-day moving average, USD/JPY is still within an exceptionally strong bullish trend and continues to maintain a bullish outlook. A major upside price target on a breakout above the noted 105.43 high resides around 108.00. Downside support levels on any subsequent pullbacks reside around the 103.00 and then 101.50 price levels.
James Chen, CMT
Chief Technical Strategist
City Index Group
Forex trading involves a substantial risk of loss and is not suitable for all investors. This information is being provided only for general market commentary and does not constitute investment trading advice. These materials are not intended as an offer or solicitation with respect to the purchase or sale of any financial instrument and should not be used as the basis for any investment decision.


