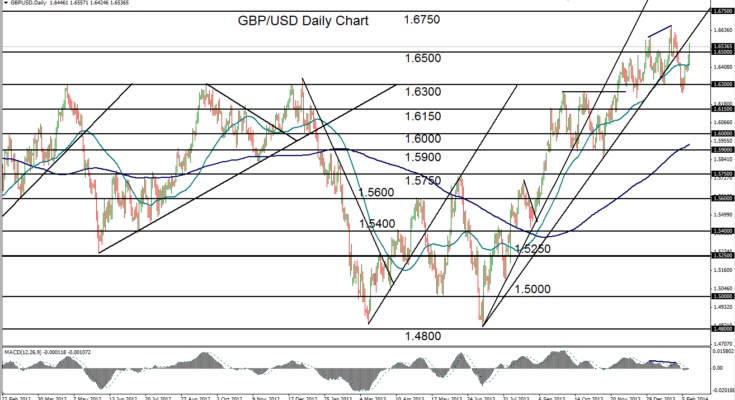
February 12, 2014 – GBP/USD (daily chart) has risen once again to maintain its bullish bias after having rebounded from a significant decline that began two weeks ago. That decline brought the currency pair down from its multi-year high of 1.6667 in late January to a low of 1.6250 in early February, breaking down below a key uptrend line in the process. Dipping below key support around 1.6300, the pair has subsequently made a sharp rebound to climb back above its 50-day moving average and, most recently, above the 1.6500 resistance level.
Two opposing technical scenarios could play out for the pair. If upside momentum fails and is unable to breach the noted 1.6667 multi-year high, a bearish head-and-shoulders pattern could form, which may push the pair back down towards the noted 1.6300 support level and then potentially down towards a 1.5900-area target. Alternatively, in the event of a breakout above the 1.6667 high, the pair will have confirmed an uptrend continuation, with an immediate upside target at 1.6750 and then potentially up towards 1.7000 to extend the bullish trend.
James Chen, CMT
Chief Technical Strategist
City Index Group
Forex trading involves a substantial risk of loss and is not suitable for all investors. This information is being provided only for general market commentary and does not constitute investment trading advice. These materials are not intended as an offer or solicitation with respect to the purchase or sale of any financial instrument and should not be used as the basis for any investment decision.


