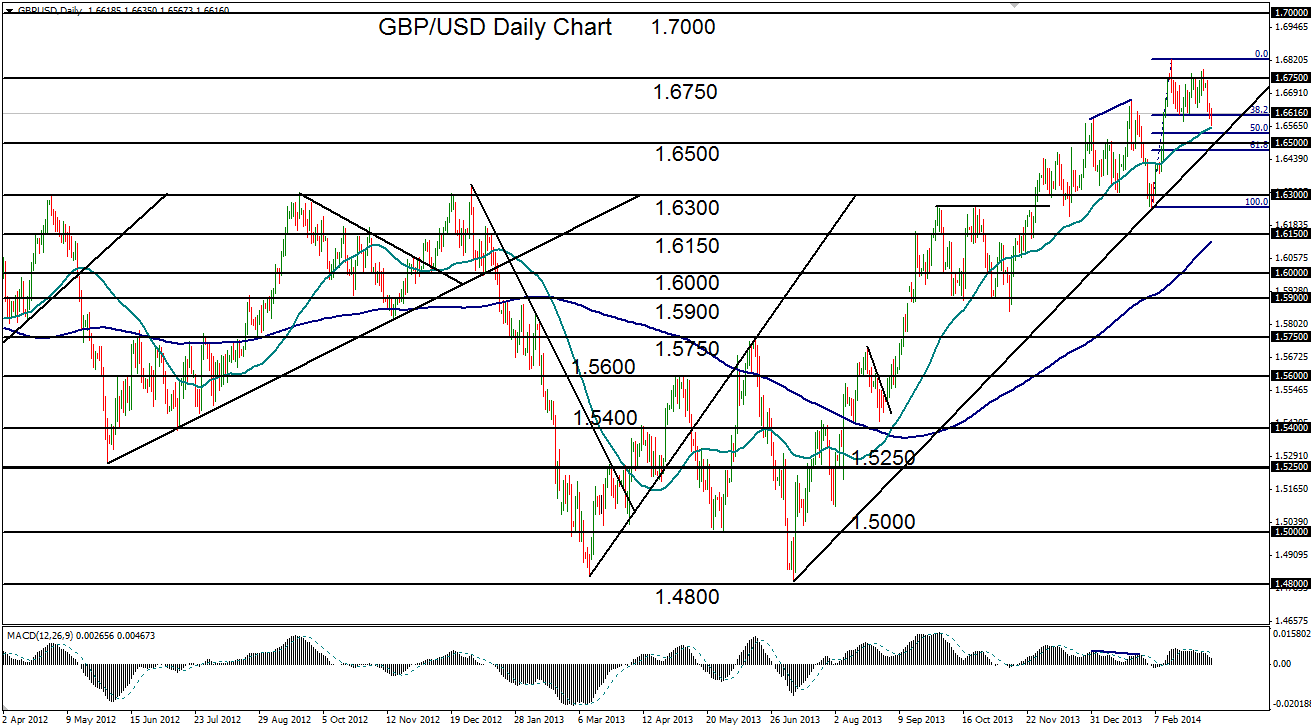

March 12, 2014 – GBP/USD (daily chart) has fallen back down to its 50-day moving average in a modest pullback this week. This pullback occurs after a consolidation that followed a new four-year high at 1.6821 that was reached just three weeks ago in mid-February. Despite the pullback, the currency pair continues to trade within a major bullish trend that extends back to the 1.4800-area double-bottom low in July of 2013. Having declined on Wednesday to hit a low of 1.6567, which came short of reaching down to a major 50% Fibonacci retracement level, GBP/USD subsequently gave some indication of a small and tentative rebound from its 50-day moving average.
If price action is able to establish stable support around the current lows, the currency pair could be poised for a resumption of the bullish trend after the current price dip. In this event, upside targets continue to reside around 1.6750 and then a re-test of the noted four-year high of 1.6821 – a breakout above which would confirm an uptrend continuation with a further upside target around the 1.7000 level. In the alternate event of a breakdown below the 50-day moving average, the major downside support target resides around the 1.6300 level.
James Chen, CMT
Chief Technical Strategist
City Index Group
Forex trading involves a substantial risk of loss and is not suitable for all investors. This information is being provided only for general market commentary and does not constitute investment trading advice. These materials are not intended as an offer or solicitation with respect to the purchase or sale of any financial instrument and should not be used as the basis for any investment decision.


