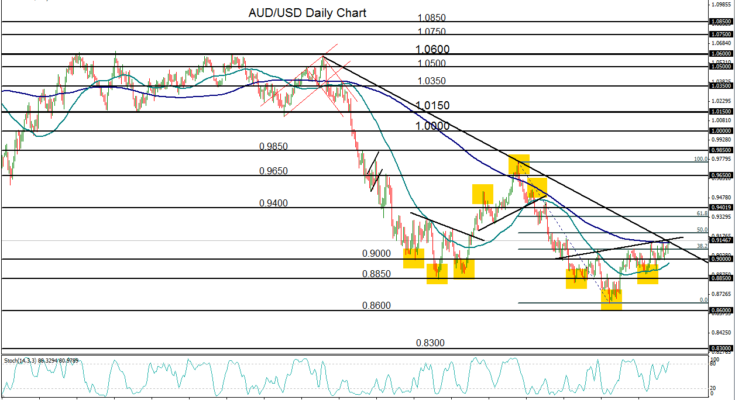
March 25, 2014 – AUD/USD (daily chart) has once again risen to test major resistance at its 200-day moving average. In the process, the currency pair has reached a three-month high. It has also pushed up against the resistance imposed by a key bearish trend line that extends back to the April 2013 high near 1.0600. Finally, the pair has also risen to the neckline of an inverted head-and-shoulders pattern, which can often be a potential signal of a bottoming out and subsequent trend change. AUD/USD has formed at least two other valid head-and-shoulders patterns on the daily chart within the past year.
If the pair is able to breakout and rise significantly above its current confluence of resistance – the noted moving average, trend line, and head-and-shoulders neckline – the key upside target to watch is the 0.9400 level, and potentially further up towards the 0.9600 level. Any failure to breach the current resistance could prompt the pair to resume its year-long bearish trend. Immediate downside support continues to reside around the 0.9000 psychological support level and the 50-day moving average.
James Chen, CMT
Chief Technical Strategist
City Index Group
Forex trading involves a substantial risk of loss and is not suitable for all investors. This information is being provided only for general market commentary and does not constitute investment trading advice. These materials are not intended as an offer or solicitation with respect to the purchase or sale of any financial instrument and should not be used as the basis for any investment decision.


