 Image Source:
Thanks to an out-of-the-office business appointment, today’s piece will be a bit more brief than usual. Some things that have caught my attention this morning include investor’s understandable love for optimistic corporate guidance, their disdain for GAAP earnings, another yield curve disinversion, and continued bad breadth. For brevity’s sake, we will present them in the form of an outline rather than the usual paragraph format.
Guidance!
Broadcom () had a modest beat on current earnings, but it’s the optimistic guidance that got the stock zooming. The opposite was the case with Oracle () and Adobe () earlier this week. It’s quite clear that an EPS beat in the current quarter is a necessary, but not a sufficient condition for a rally.
Remember that one of the pillars of the market’s valuation is that there is a general expectation for S&P 500 () earnings to be up about 15%. Considering that real GDP is expected to be about 3% and inflation is running about 3%, that implies that big companies can grow earnings by an incremental 9%.That’s doable, but it implies that a lot of profit optimism is already baked into stock prices. Any shortfall is being punished, often harshly.
Do GAAP earnings matter? Apparently not. On a GAAP basis, AVGO earned $0.94 but reported $1.42 on a pro-forma basis. This spread is typical for AVGO, along with a wide range of tech and other companies. Remember that pro-forma earnings exclude certain costs that a company believes distort its true profitability,
Pro-forma all but assures that a company can beat its number.It’s nice to be able to selectively exclude expenses.
Hence the focus on revenues, cash flows and guidance.Those are unadulterated.
Once again there are far more SPX decliners vs. advancers (367-130 as I type this). On the NYSE it’s 2.5:1 for the decliners.The rally is narrowing, not broadening.
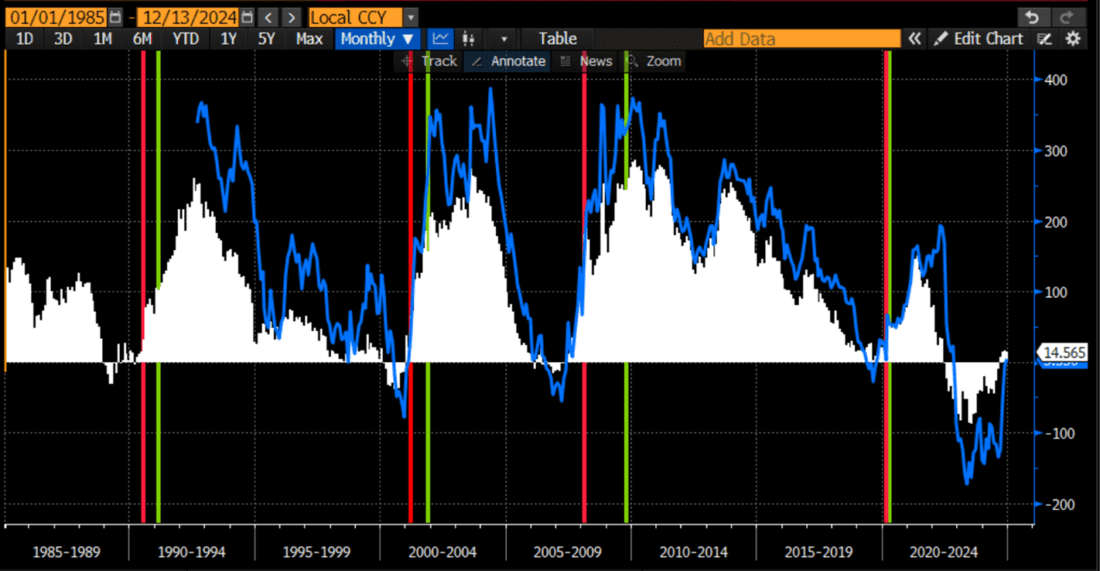
The 3mo/10yr yield curve finally disinverted.Most of us have been focused on the 2-10 relationship, but one can argue that the 3mo-10y is more important because it more directly affects a bank’s cost of funding. Either way, the following chart shows that while inverted yield curves are a considered a harbinger of recessions, the recessions only begin AFTER the curve normalizes:
(in chart below, white histogram is 2-10, blue line is 3m-10, red is when NBER declared the start of a recession and green is when they say it ended)
Spreads Between 2yr and 10yr US Treasuries (white), 3mo and 10yr Treasuries (blue), Recession Starts (red) and Ends (green) as Determined by NBER
(Click on image to enlarge) Source: Bloomberg, Interactive Brokers GAAP: Generally Accepted Accounting PrinciplesMore By This Author:
It’s All About Guidance, Once Again

