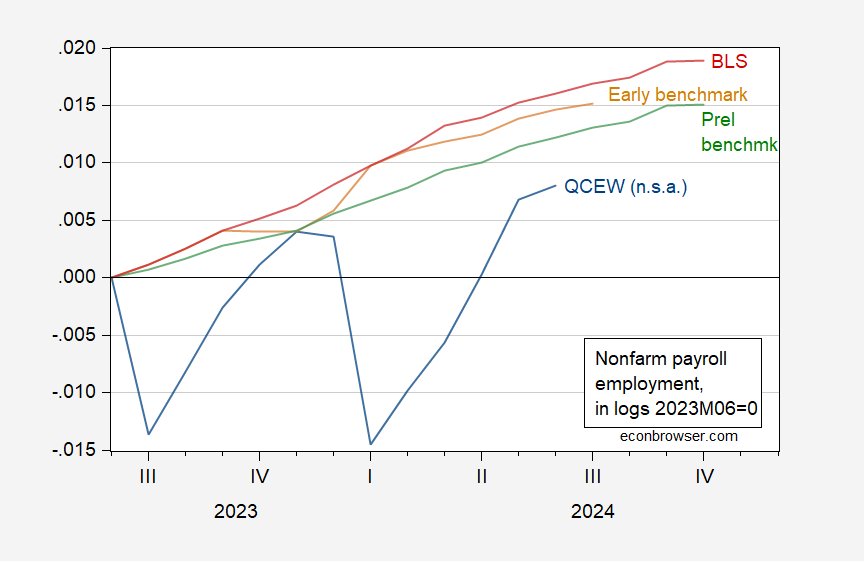
The percentage change is less than that for the CES estimate. Does this mean there are a lot fewer people employed that indicated by the official series (e.g. )? Here’s data from 2023M06 onward:(Click on image to enlarge) Figure 1: Change in total covered employment in Quarterly Census of Employment and Wages (QCEW), not seasonally adjusted (blue), official BLS nonfarm payroll employment (NFP) (red), early benchmark NFP (tan), and preliminary benchmark implied (green), all relative to 2023M06. Source: BLS, BLS via FRED, Philadelphia Fed, and author’s calculations.While typically it’s assumed the preliminary benchmark will be more accurate given the use of tax data, to the extent there is a substantial component of undocumented workers not having tax data reported on them, it might be the case that both preliminary benchmark and QCEW will be understating employment growth.More By This Author:Russia: Policy Rate At 21%, Official Inflation Rate At 10% (M/M Annualized) Natural (But Stupid) Experiments?The Return Of Economic Policy Uncertainty
QCEW Employment Change Y/Y To June 2024

