 Image Source:
Monitoring purposes; Long SPX on 10-29-24 at 5832.92Our Gain 1/1/23 to 12/31/23 SPX= 28.12%; SPX gain 23.38%Monitoring purposes GOLD:Long on 10/9/20 at 40.78.
We are up over 27% this year so far; SPX up around 20%. Seasonality is very bullish this week. Above is a short term view. A “Selling climax” form last Thursday suggesting exhaustion to the down side and also closed below its lower Bollinger band, which is also bullish. The TRIN closed at 1.15 last Thursday which leans bullish.Last Friday the TRIN close at 1.20 and shows panic another bullish sign.Today the tested last Thursday’s “Selling Climax” low on lighter volume which suggests support. Today the TRIN reached panic levels at 1.22 which is another sign for a low. Our assessment for the SPY is that the closing low came last Thursday and the enter day low came today. Long SPX on 10/29/24 at 5832.92.
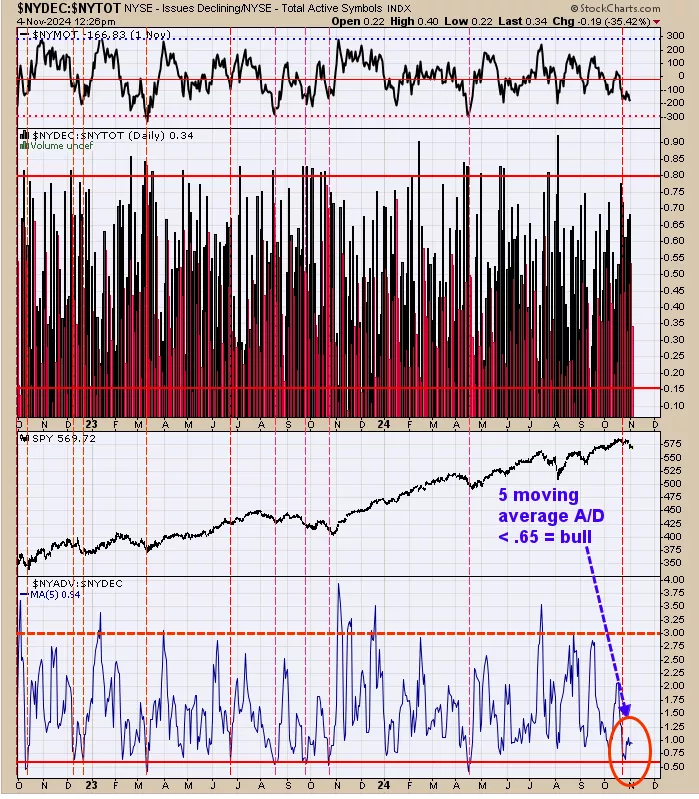
Seasonality turns very bullish this election week and we want to be long the market (long SPX on October 29 at 2832.92). The indicator above turn bullish Friday October 25. The bottom window is the NYSE advancing /NYSE declining with a 5 day average. This indicator turns bullish when it reaches below .65; noted with red dotted vertical lines (reached .63 on October 25). We noticed when this indicator reached bullish levels the short term trend had minimal downside. (Click on image to enlarge)
For the folks who like to look at the big picture for the XAU, the above chart will have your interest. The middle window is the monthly XAU/Gold ratio dating back to 1984 and the bottom window is the monthly slow stochastic for this ratio.Major lows in XAU are found when the monthly slow stochastic trades below 10 and than turns up. We noted those times with blue lines.The last buy signal came in August 2022. Significant sell signals occur when the monthly slow stochastic reaches above 85; noted with red lines.The current slow stochastic reading stands at 70.73 and has room to run before hitting 85. Trend remains up.More By This Author:
Bullish Seasonality

