Following futures positions of non-commercials are as of October 29, 2024.10-year note: Currently net short 901.2k, up 53k.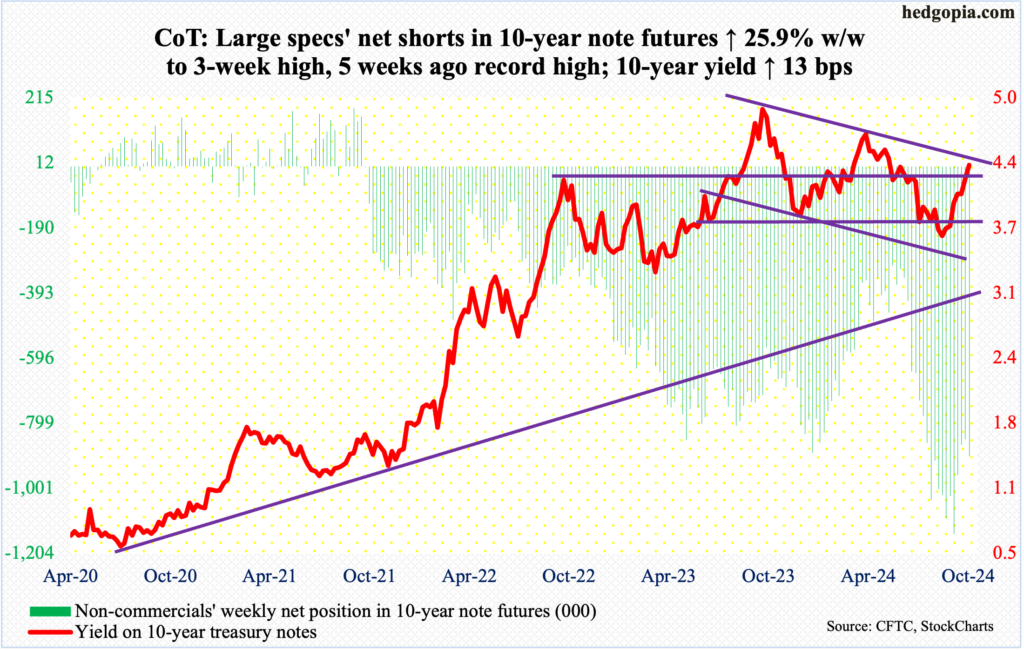 The FOMC meets next week on Tuesday-Wednesday. A 25-basis-point cut is priced in. Immediately after the policy-setting body reduced the fed funds rate by 50 basis points on September 17-18, futures traders were expecting another 50 next week and a 25 in December (17-18), followed by additional 125 basis points of easing next year, ending 2025 between 275 basis points and 300 basis points. Rates are currently at a range of 475 basis points to 500 basis points. This was way more than what the Federal Reserve had telegraphed it was willing to give.Fast forward to now, these traders have much more rational expectations. Facing an economy that is holding its own and inflation that is proving sticky just above the Fed’s two percent objective, they are betting on another 25 in December and at best three 25-basis-point cuts next year, ending between 350 basis points and 375 basis points. In the event macro data continues to surprise on the upside, it is probable they will have to price out one or two cuts in the months ahead, as they have done the last several weeks. 30-year bond: Currently net short 54.8k, down 19k.
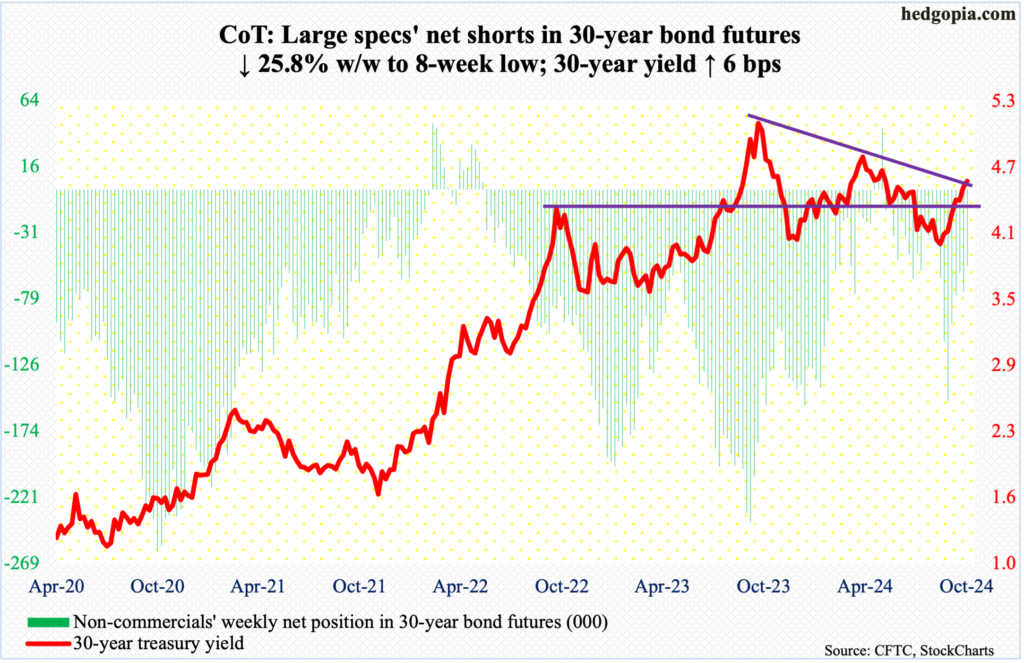 Major US economic releases for next week are as follows.Durable goods orders (September, revised) are on schedule for Monday. Preliminarily, September orders for non-defense capital goods ex-aircraft – proxy for business capex plans – rose 0.5 percent month-over-month to a seasonally adjusted annual rate of $74.1 billion. This was a fresh record.The ISM services index (October) comes out on Tuesday. Non-manufacturing activity jumped 3.4 percentage points m/m in September to 54.9 percent, which was the highest reading since February last year.Thursday brings labor productivity (3Q24). In the June quarter, non-farm output per hour increased 2.7 percent from a year ago. This was the fifth quarter in a row of productivity growth, coming on the heels of five successive quarters of decline.University of Michigan’s consumer sentiment index (November, preliminary) is scheduled for Friday. Sentiment edged up 0.4 points m/m in October to 70.5 – a six-month high. March’s 79.4 was the highest since July 2021.WTI crude oil: Currently net long 142.1k, down 1.1k.
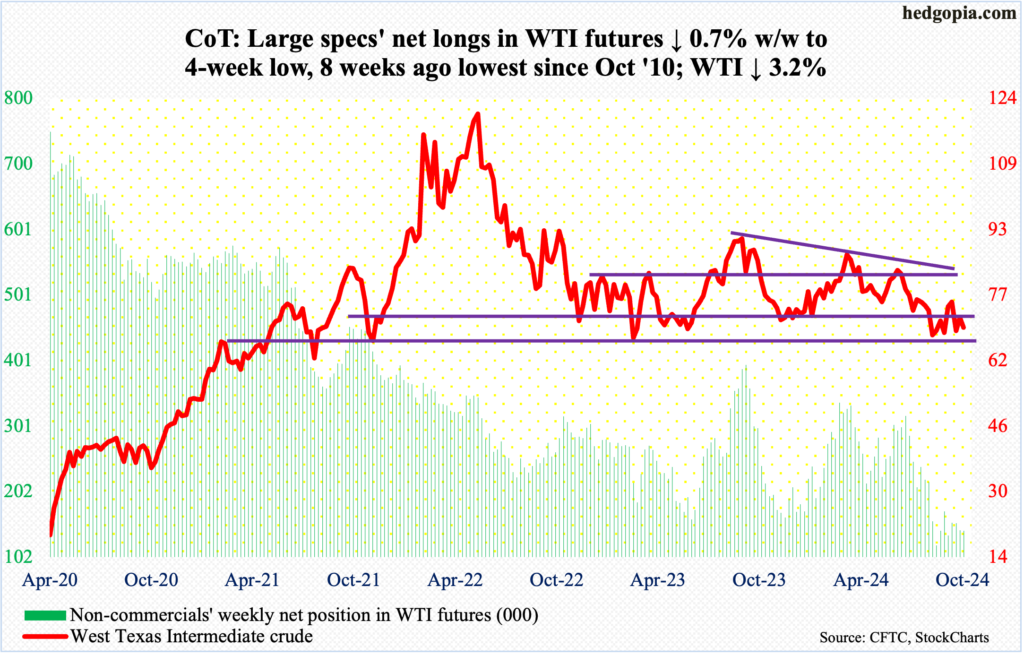 For nearly two months, West Texas Intermediate crude has gone sideways to potentially build a base at $66-$67, with a high of $78.46 on October 8 and a low of $65.27 on September 10. The crude earlier peaked at $95.03 in September last year.This week, at Friday’s high of $71.45, the crude would have been only down $0.33 for the week, but sellers showed up just above the 50-day moving average to end the week down 3.2 percent to $69.49/barrel, forming a weekly spinning top.Friday’s high was also a rejection at a broken, months-long range between $71-$72 and $81-$82. For now, hence, WTI is trapped between $66-$67 and $71-$72.In the meantime, US crude production in the week to October 25 was unchanged for three consecutive weeks at 13.5 million barrels per day – a record. Crude imports decreased 456,000 b/d to six mb/d. Stocks of crude, gasoline, and distillates all fell – down respectively 515,000 barrels, 2.7 million barrels and 977,000 barrels to 425.5 million barrels, 210.9 million barrels and 112.9 million barrels. Refinery utilization shrank four-tenths of a percentage point to 89.1 percent.E-mini S&P 500: Currently net long 62.7k, up 39.7k.
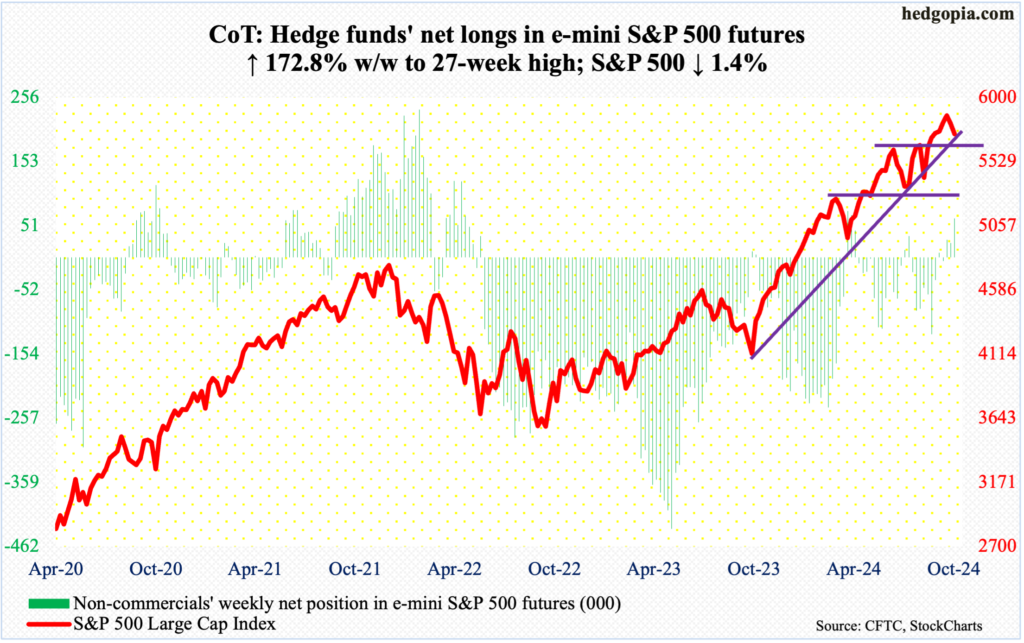 Last week, horizontal support going back a month at 5760s was tested and defended. This week, the support gave way in Thursday’s gap-down, bearish marubozu session. This was followed by Friday’s intraday reversal at that support-turned-resistance as the session went on to form a shooting star.For the week, the S&P 500 gave back 1.4 percent to 5729 – a back-to-back down week. It earlier peaked at 5878 on October 17.There is plenty of room for the weekly to continue to unwind its overbought condition. The daily, however, will soon enter oversold territory. Thursday’s low of 5703 tested the 50-day, which remains intact. A breach of the average will bring into focus horizontal support at 5670s, which likely attracts bids at the first go; a breach, however, will significantly build momentum in bears’ favor.Euro: Currently net short 50.3k, up 21.8k.
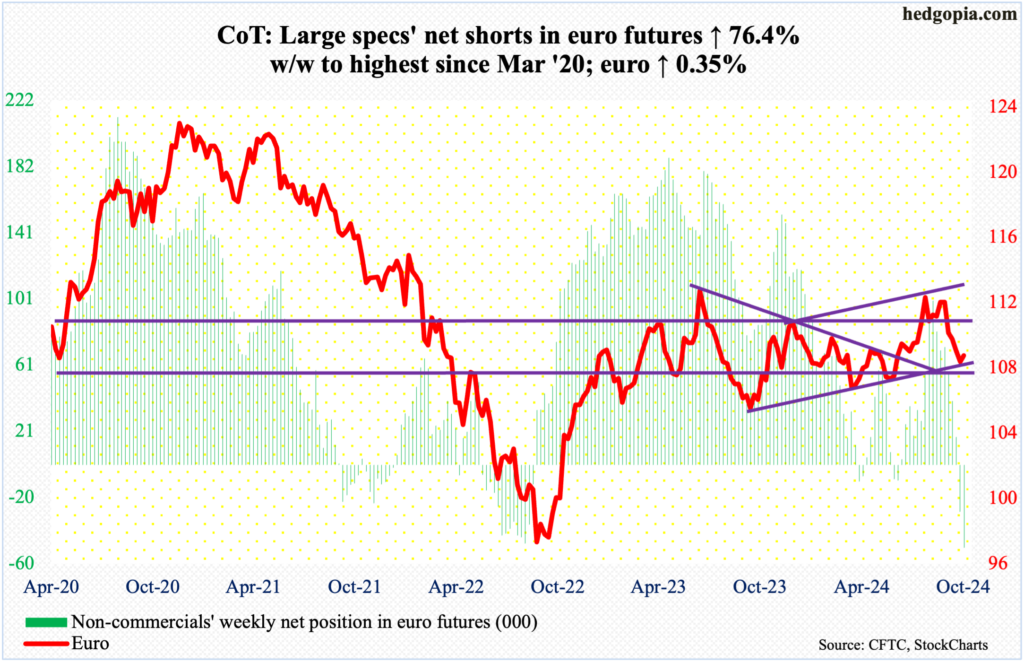 The euro rallied 0.35 percent to $1.0834 to secure a first up week in five.On September 30, after facing rejection at $1.12 for six consecutive weeks, the currency sharply fell, proceeding to breach crucial lateral support at $1.10 by the 4th last month, eventually dropping as low as $1.0761 on the 23rd.Last week was a down week, but there was some buying at trendline support from October last year. This week, that support was once again in play as the euro reversed higher on Tuesday after tagging $1.0769 intraday.This is positive for euro bulls. For two weeks in a row, they stepped up where they could possibly have. Before they could go after broken support at $1.10, they need to first reclaim $1.09, which also approximates the 200-day at $1.087; Friday’s intraday attempt to recapture the average failed, with an intraday high of $1.0906 drawing heavy selling.Gold: Currently net long 278.7k, down 17.6k.
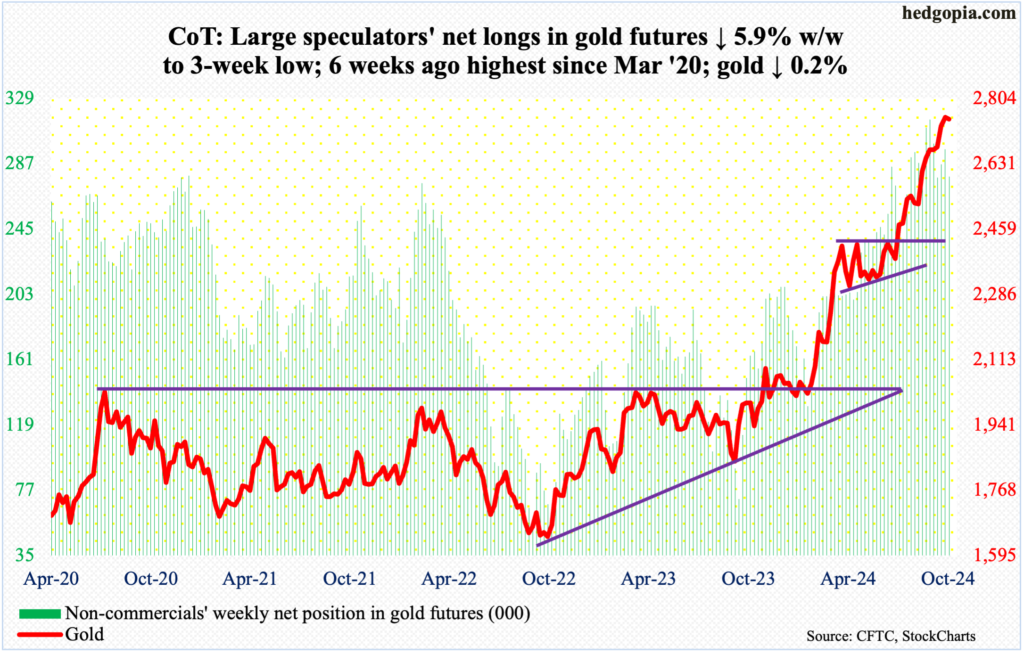 Gold just flashed first signs of exhaustion. This week’s weekly gravestone doji showed up after six up weeks in seven, falling 0.2 percent to $2,749/ounce and posting a new high of $2,802 on Wednesday.The metal has rallied relentlessly since June when it ticked $2,305. Since then, there have been several breakouts. Six weeks ago, after five sessions of sideways action at $2,610s, it broke out on September 20. This followed a breakout in the prior week at $2,540s-50s after several unsuccessful attempts since mid-August. Prior to this, after more than three months of sideways action, gold broke out at $2,440s-50s in August.Before the first layer of support at $2,610s gets tested, gold bugs’ mettle is likely to be tested just north of $2,700.Nasdaq (mini): Currently net long 5.1k, up 2.5k.
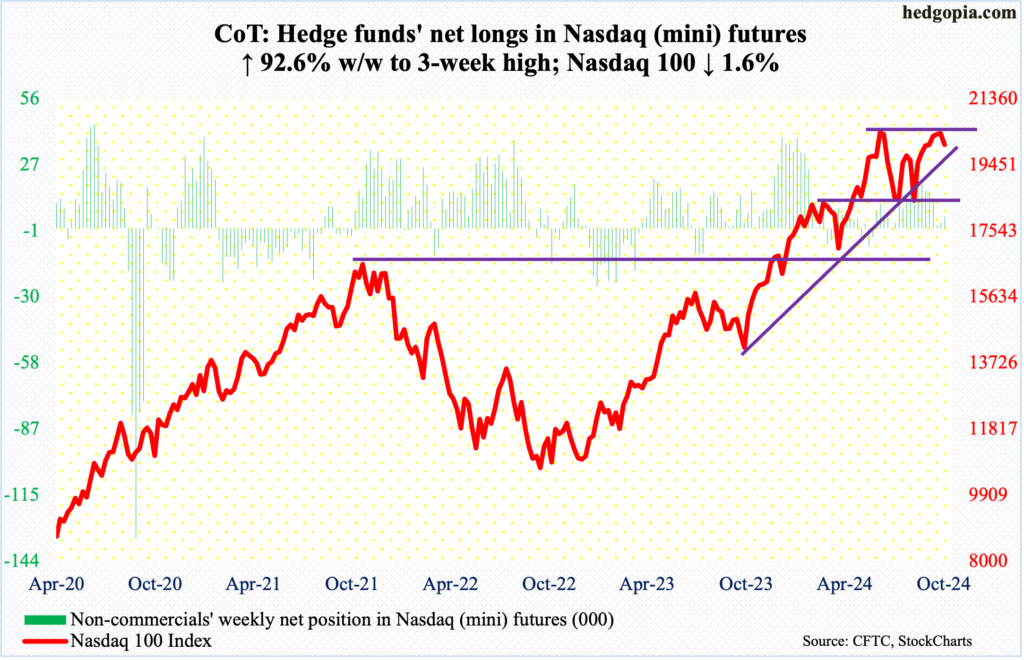 The Nasdaq 100 had its first down week in seven, dropping 1.6 percent to 20033. This has come at an important juncture. At Tuesday’s intraday high of 20600, the tech-heavy index was less than 100 points from its all-time high of 20691 posted on July 10.A potential double-top is in the making.This week’s decline comes amidst September-quarter results from five leading tech outfits – Google parent Alphabet (GOOG), Microsoft (MSFT), Facebook parent Meta (META), Apple (AAPL) and Amazon (AMZN).The index is within striking distance of lateral support at 20000. After that comes the 50-day at 19795.Russell 2000 mini-index: Currently net long 11.9k, down 6.8k.
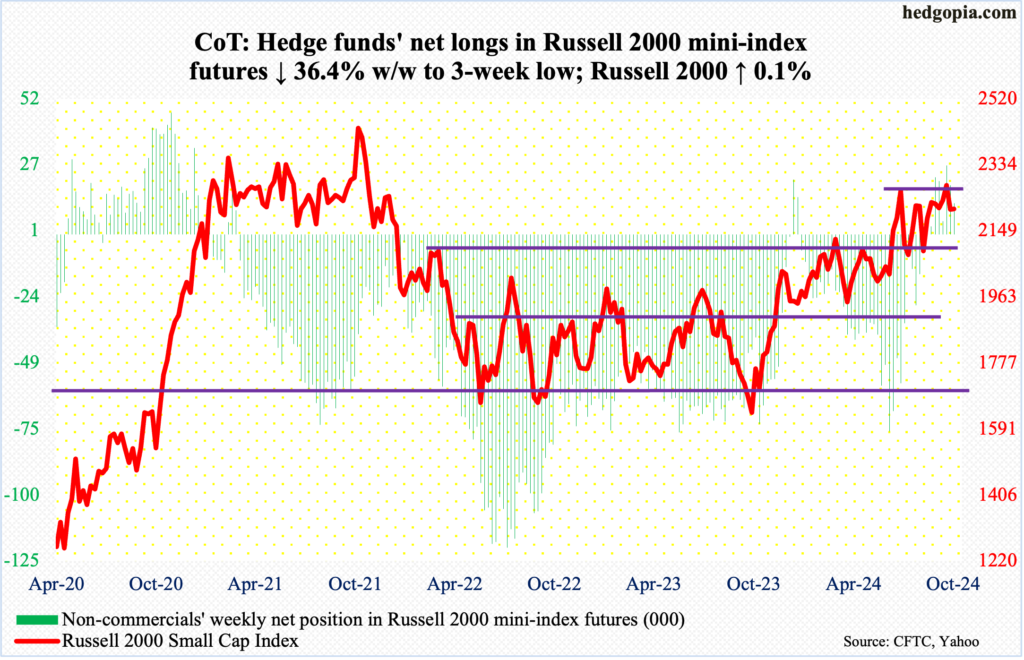 The Russell 2000 edged up 0.1 percent this week to 2210 but was up as much as 2260 on Wednesday. Horizontal resistance at 2260s goes back to mid-July. Three weeks ago, the small cap index eked out a breakout, ticking as high as 2289 on October 16, but only to fall back down in the subsequent week.Big picture, the Russell 2000 remains significantly under its all-time high of 2459 from November 2021.From small-cap bulls’ perspective, the good thing is that the index remains above 2200, which, if breached, will open the door toward breakout retest at 2100.US Dollar Index: Currently net long 1.7k, up 773.
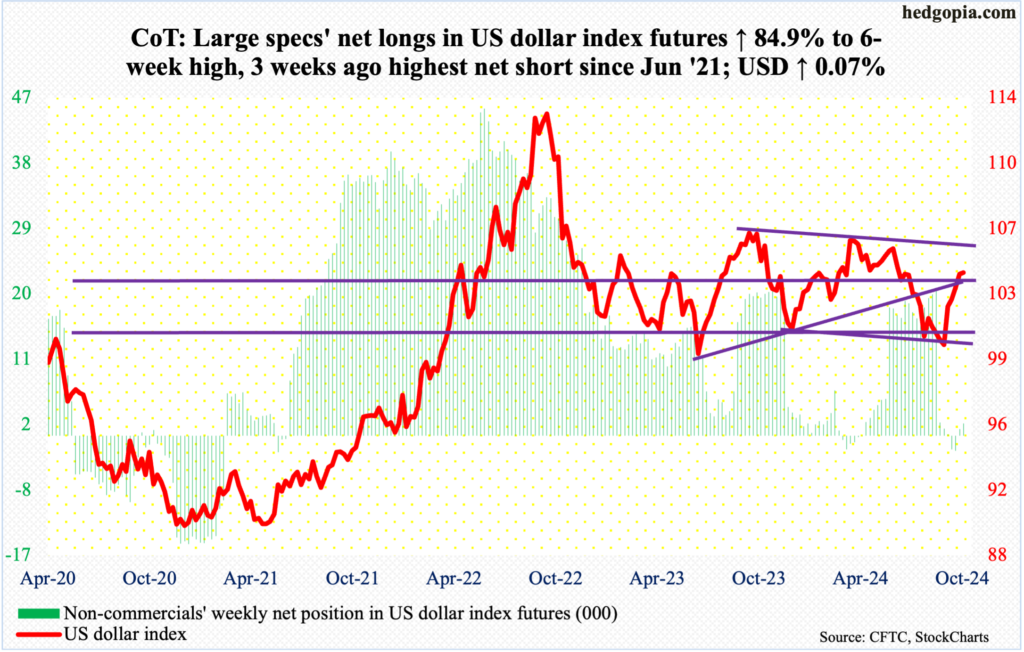 The US dollar index has now closed above the 200-day for 10 sessions now, but momentum slowed this week, edging up 0.07 percent to 104.20. This was its fifth up week in succession.The index began to reverse higher on September 30, after having gone sideways just under 100 for several sessions.Earlier, the US dollar index had been under pressure since ticking 105.80 in June; this was preceded by highs of 106.38 in April and 107.05 last October, establishing a pattern of lower highs. This trendline resistance lies at 105.30s. Dollar bulls would love to go test this resistance, but, again, momentum is decelerating. Horizontal resistance at 103-104 goes back to December 2016.VIX: Currently net short 1.6k, up 5.6k.
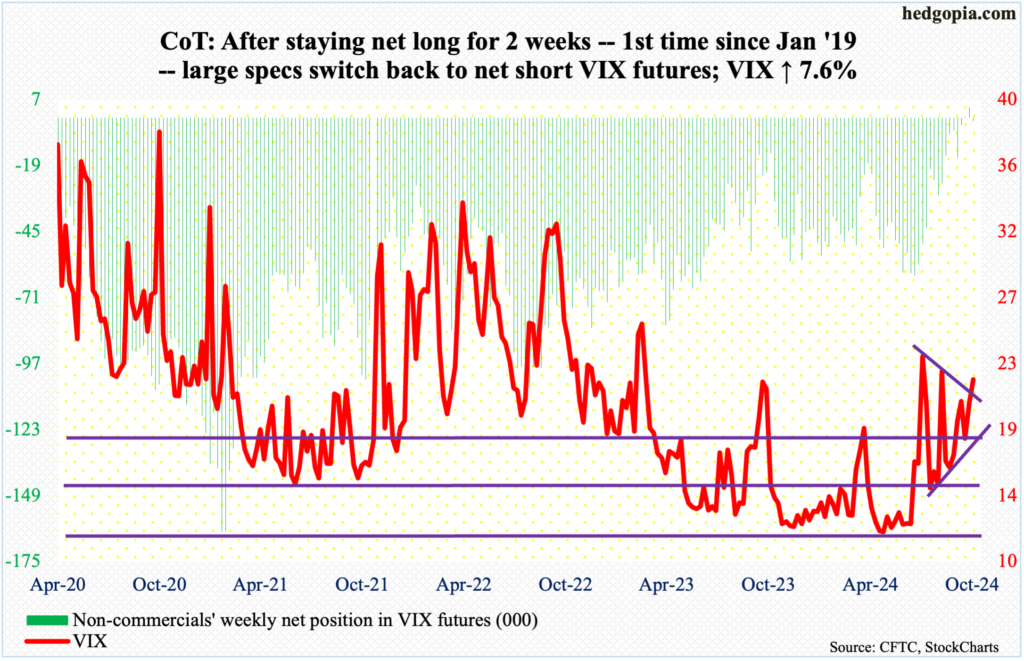 For nearly two months now, VIX’s rally attempts were stopped north of 23. This continued this week, as the volatility index touched 23.42 on Thursday before ending the week at 21.88, up 1.55 points for the week.Before this week’s increase in volatility, the daily Bollinger bands were narrowing. If past is prelude, when this happens, VIX tends to make a sharp move – in either direction. The bands expanded this week but can continue to do so in the right circumstances. For that to happen, resistance north of 23 must fall.Thanks for reading!More By This Author:
Per COT, Peek Into Future Through Futures, How Hedge Funds Are Positioned

