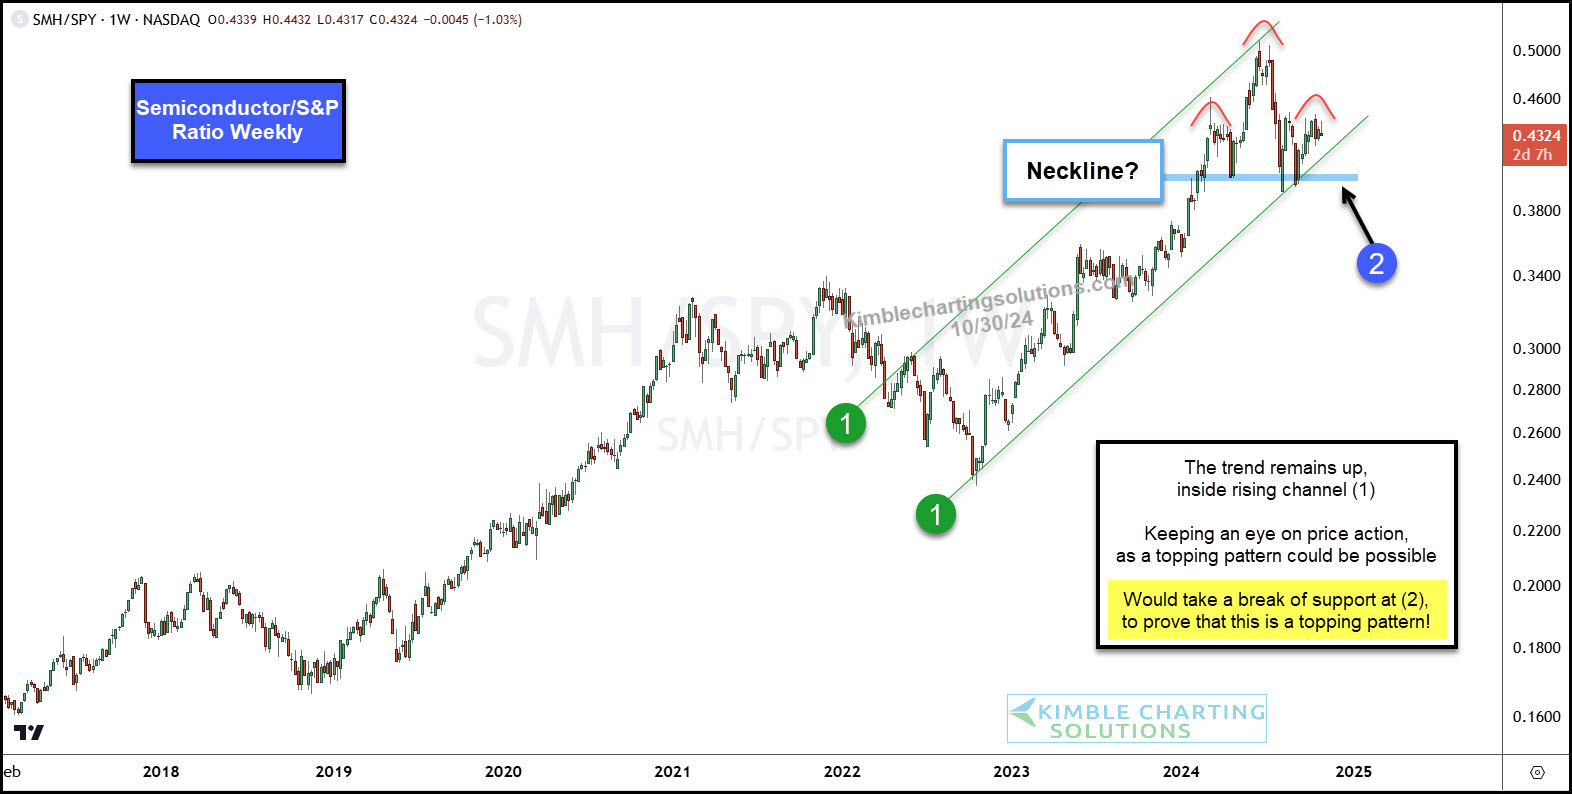
Over the course of the 15 year bull market, investors have seen important pockets of leadership emerge.And, as we have , leadership has come in large part due to tech stocks and, more specifically, semiconductor stocks.Today we highlight a pattern that could be pointing to weakness in leadership.Below is a “weekly” performance ratio chart of the Semiconductors sector ETF () to the S&P 500 ETF ().As you can see, the Semiconductors sector (SMH) have shown weakness in 2024. In fact, the ratio peaked on the first day of summer before making a lower high recently.That weakness, however, has not lead to a wholesale selloff… yet. BUT it this head and shoulders pattern continues to take shape and breaks support at (2), it would suggest that Tech leadership is taking a breather… And a bigger selloff may be afoot.Seems like an important ratio to watch!(Click on image to enlarge) More By This Author:
Will Bearish Pattern Take Semiconductors (And The Stock Market) Lower?

