
Magnificent 7 Earnings Impress
The market loved the Tesla ( – ) report last week, with the EV-maker’s release kicking off the Q3 reporting cycle for the Mag 7 group. At the headline level, Tesla modestly missed on revenues while handily beating consensus earnings estimates. In terms of the growth pace, Tesla’s Q3 earnings were up +16.9% from the same period last year on +7.8% higher revenues.Tesla shares have been the Mag 7 group’s laggards this year, with the stock now up +5.4% after the roughly +20% post-release bounce. What excited Tesla investors is developments on the margins front, which expanded notably relative to other recent periods. While we don’t know the specific drivers of this margin improvement, some believe that Q3 deliveries included an above-average proportion from the higher-margin Shanghai factory. In any case, the margin improvement is interpreted as a stabilization sign in the EV market’s competitive pressures.We can confidently say that the Tesla report offers no read-throughs to the rest of the Mag 7 group. But that’s not the case with Alphabet ( – ), whose Q3 results were also cheered by the market. Sentiment on Alphabet had taken a hit since the July 23rd quarterly release, with investors increasingly uncomfortable with the company’s ever-rising spending on building its artificial intelligence infrastructure.Underpinning this worry about Alphabet’s AI spending, which investors also have for other Mag 7 players, particularly Microsoft ( – ), has been management’s inability to articulate how these investments will get monetized. It appears that they made that case in the Q3 release, with AI capabilities improving internal operating efficiencies and starting to drive growth.Alphabet’s cloud revenues increased +35% in Q3, accelerating from Q2’s +29% and Q1’s +28% growth pace. Management credited AI capabilities for helping bring new clients and allowing for bigger contract wins. Management noted on the call that about a quarter of their code-writing activity was now AI-driven. Given how programming-heavy all of Alphabet’s products are, this may be one of the most tangible examples of AI capabilities driving productivity gains.The Mag 7 stocks ceded their market leadership role in recent months, likely reflecting a combination of valuation worries and investors’ worries about ever-rising AI-centric capital expenditures, as noted in the context of Alphabet’s results.One could argue that the group will try to reclaim its market leadership role if the rest of the Mag 7 results mirror what we saw from Tesla and Alphabet.You can see this shift in the year-to-date chart below. Aside from Nvidia and Meta, the other five are now lagging the market.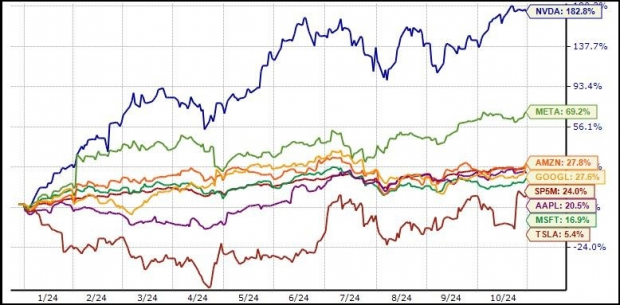
Image Source: Zacks Investment ResearchThe Q3 earnings results in the days ahead will provide these companies another opportunity to make the case. This is particularly significant for Alphabet, Microsoft, and Amazon, though developments related to AI are relevant to all of them.The market’s current issues with the Mag 7 stocks notwithstanding, there is no escaping the fact that these mega-cap operators are enjoying sustainable profitability growth. These seven companies collectively are on track to bring in $116.1 billion in earnings in Q3 on $488.7 billion in revenues. This represents year-over-year earnings growth of +20.1% on +14.0% higher revenues.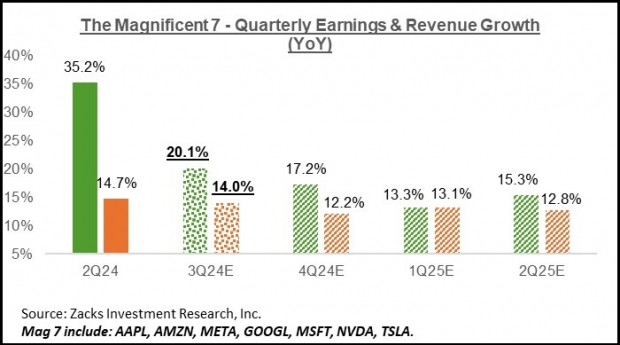
Image Source: Zacks Investment ResearchThe Mag 7 companies are on track to account for 21.7% of all S&P 500 earnings in Q3. In fact, had it not been for the Mag 7’s substantial earnings contribution, Q3 earnings for the remaining S&P 500 index would be modestly in the negative territory.
The Earnings Big Picture
Looking at Q3 as a whole, combining the actual results that have come out with estimates for the still-to-come companies, total earnings for the S&P 500 index are now expected to be up +4.4% from the same period last year on +5.2% higher revenues.The Q3 earnings growth pace would improve to +6.8% had it not been for the Energy sector drag (decline of -26.6% for Energy). On the other hand, quarterly earnings for the index would be up +0.4% once the Tech sector’s hefty contribution is excluded (earnings growth of +14.6% for the Tech sector).The quarterly earnings growth pace is expected to improve from next quarter onwards. You can see this in the chart below, which shows the overall earnings picture on a quarterly basis.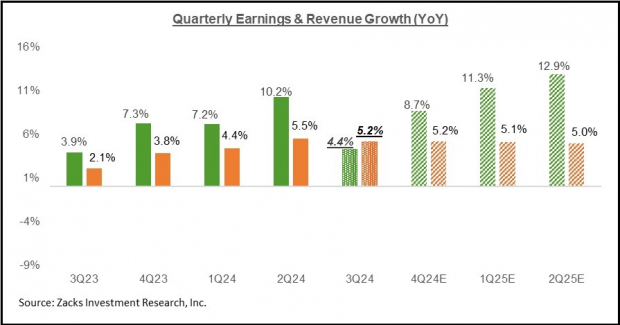
Image Source: Zacks Investment ResearchFor the current period (2024 Q4), total S&P 500 earnings are expected to be up +8.7% on +5.2% higher revenues. Q4 earnings would be up +10.5% had it not been for the Energy sector drag.Estimates for the period have started coming down since the quarter got underway. Still, the pace and magnitude of negative revisions are less than we had seen in the comparable period of Q3. You can see this in the chart below that shows how Q4 estimates have evolved in recent weeks.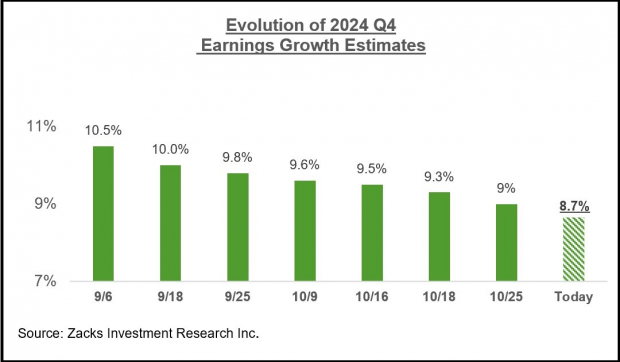
Image Source: Zacks Investment ResearchThe chart below shows the overall earnings picture on an annual basis.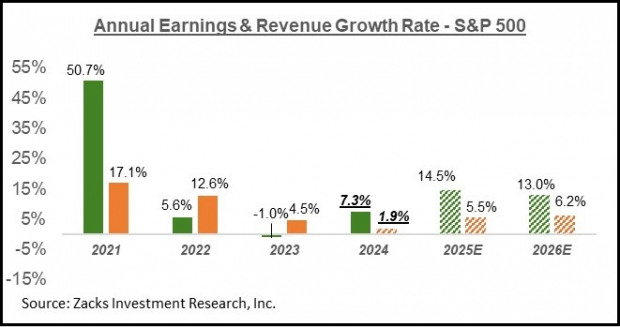
Image Source: Zacks Investment ResearchPlease note that this year’s +7.3% earnings growth on only +1.9% top-line gains reflects revenue weakness in the Finance sector. Excluding the Finance sector, the earnings growth pace changes to +6.3%, and the revenue growth rate improves to +4.2%. In other words, about half of this year’s earnings growth comes from revenue growth, with margin gains accounting for the rest.More By This Author:

