 Image Source:
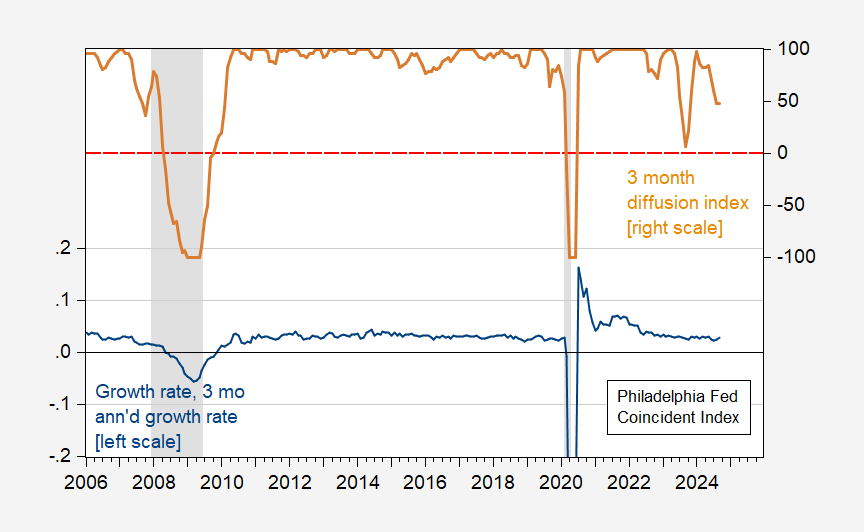
Three month growth rate 2.7% and, 3 month diffusion index at 48.(Click on image to enlarge) Figure 1: 3 month annualized growth rate in the Coincident Index for the US (blue, left scale), 3 month growth rate diffusion index (tan, right scale). NBER defined peak-to-trough recession dates shaded gray. Source: , NBER, and author’s calculations.
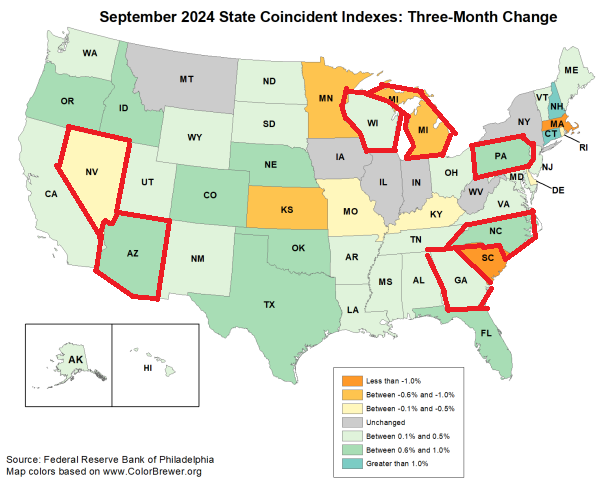
Here’s an annotated map of the US. Red outlines are for battleground states. Source: (Sept).More By This Author:If The Official Inflation Rate Is Correct, The Real Policy Rate In Russia Is Now 12.4% The Leading Economic Index, The Term Spread, And Historical CorrelationsFederal Interest Payments: To The Public Vs. To the Rest-Of-Federal Government
September Coincident Indexes

